
Key Insights
- UNI broke a long-term downtrend, now consolidating around $7.70, signaling possible bullish momentum ahead.
- Uniswap’s $4.5B market cap and strong volume support its recent breakout above resistance near $7-$10.
- Layer 2 migration aims to cut fees, boost usage—potentially driving UNI demand and price growth.
Uniswap (UNI), one of the largest decentralized finance (DeFi) protocols, has attracted significant attention with its recent price movements. After breaking above a long-term downtrend, UNI’s price shows signs of a possible sustained rally.
Investors and analysts are closely monitoring whether the token can reach new highs, with $50 often cited as a critical target. This report covers recent price action, market trends, and factors influencing UNI’s potential growth.
Market Metrics and Trading Activity Support Positive Sentiment
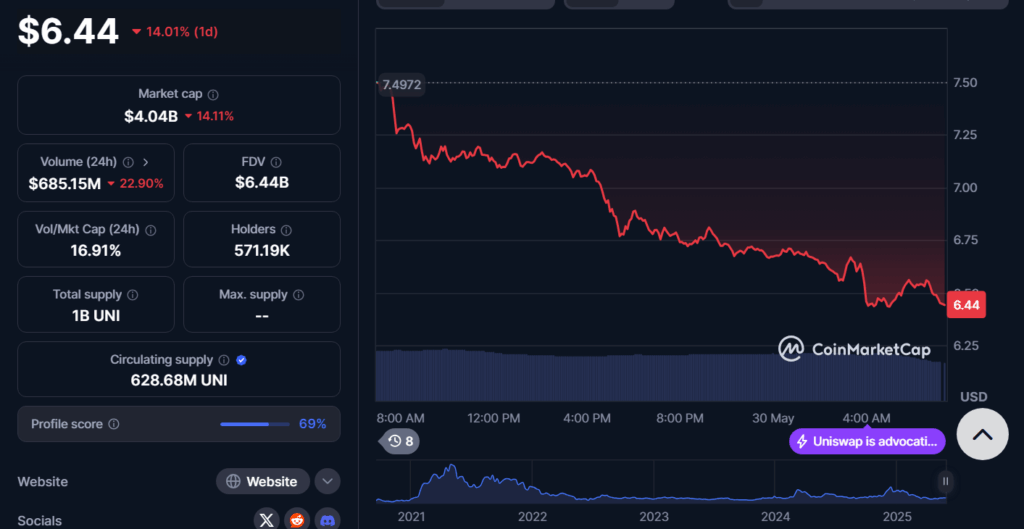
The market capitalization of Uniswap is approximately $4.58 billion, reflecting its role as one of the leading decentralized finance (DeFi) platforms.
Recent trading volume has been strong, with over $880 million in daily transactions, suggesting active participation among investors and traders.
Liquidity remains robust, and the circulating supply of UNI tokens is about 628 million, which helps maintain price stability. The fully diluted valuation stands around $6.44 billion, reflecting the total market value if all tokens are in circulation.
Volume trends and order book data indicate buyers and sellers are balanced near current price levels, with slight buyer dominance after the breakout. This could support a steady price increase if buying pressure sustains.
Technical Indicators Showing Positive Momentum Building for the Uniswap Price
The price chart of Uniswap reveals important technical developments. The breakout above the descending resistance line is a pivotal event. This technical shift suggests bullish momentum could sustain if the price remains above this trendline.
Moving averages currently show mixed signals. The 9-day simple moving average (SMA) acts as a dynamic support near $7, helping to stabilize price during pullbacks. The Relative Strength Index (RSI) remains near neutral levels, suggesting the market is neither overbought nor oversold.
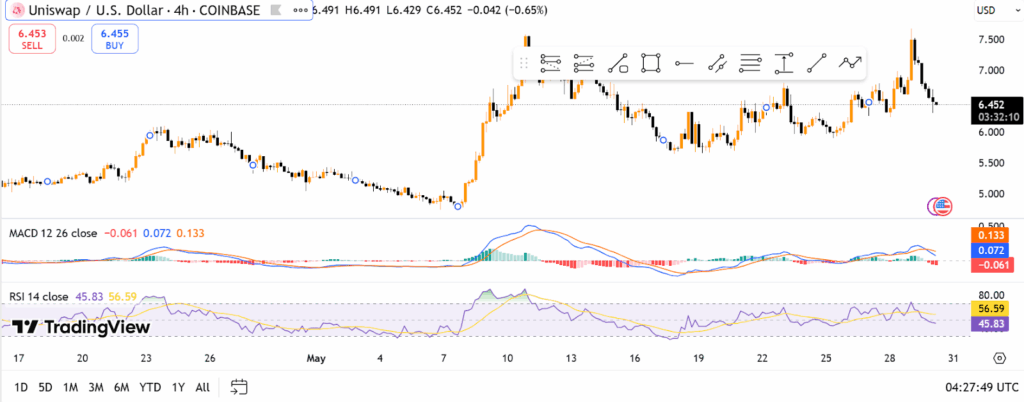
A potential price target of $62 is indicated on some charts, based on measured moves from the breakout pattern. However, this target requires confirmation through sustained buying pressure. The $10 resistance level is an immediate hurdle, with traders watching volume and momentum for clues about further gains.
Price consolidation in the $7-$10 range could build the base for a higher rally. The Moving Average Convergence Divergence (MACD) indicator shows signs of weakening bearish momentum, which could favor a renewed upward trend if positive crossover occurs.
Factors Influencing UNI Price Growth
Several fundamental factors contribute to Uniswap’s potential price growth. The protocol continues to lead in DeFi trading volume and innovation. Uniswap’s recent revenue reports indicate strong platform usage, which may attract more investors.
The migration of Uniswap activity from Ethereum Layer 1 to Layer 2 solutions is an important development. This shift aims to reduce transaction fees and improve scalability, making the platform more efficient and user-friendly. Such upgrades may boost demand for UNI tokens as the protocol expands its user base.
In addition, ongoing development funding through grants and ecosystem support strengthens the protocol’s position. Partnerships and integration with other blockchain projects may also enhance Uniswap’s growth prospects. Market sentiment remains cautiously optimistic as the project maintains leadership in decentralized exchanges.
Regulatory developments remain an external factor that could influence UNI price. While the current regulatory environment appears stable, future changes could impact investor confidence and market dynamics.
Price Outlook and Investor Considerations
Reaching $62 would be great for prices, but it also implies increased risk. It helps to look at how price acts at significant support and resistance areas. In order to confirm a rally, we must see higher highs and higher lows on the charts.
After sharp market gains, it is common to see prices drop, as people choose to take profit. Before opening any trade, investors need to check the market liquidity and how many assets are being traded.
The price going over the long-term downtrend line is taken positively by technical analysts. At the same time, what happens in the global economy and the crypto sector will also shape UNI’s direction.