
Key Insights:
- XRP has lost a major support level at $2.50, and its price action is currently showing mixed signals for traders.
- The cryptocurrency is hovering around the $2.35 Fibonacci retracement level, and a break above or below could determine its short-term moves.
- Despite short-term bearish indicators, some analysts like Crypto Yoddha see a bullish pennant pattern that could lead XRP to $5-$10.
After starting the current year on a bullish note, XRP itself has declined somewhat and is facing a crossroads. The cryptocurrency recently lost a major support level, and its price action has turned confusing for traders.
Because of this, traders and investors are left watching for signals of what comes next. Here are a few indicators flashing both bullish and bearish signals for XRP.
XRP Loses Major Support Around $2.50
For several months, XRP climbed steadily upwards within an ascending channel, in what analysts agreed to be a bullish indicator. However, this momentum stalled when the price hit resistance around $2.50.
The interesting part about this level is that it aligned with the 0.236 Fibonacci retracement zone, which means that the $2.5 price level is a psychologically and technically important point.
The rejection at $2.50 triggered a pullback, in what appears to be an attempt from the bears to push the price below the 200-day Exponential Moving Average (EMA).
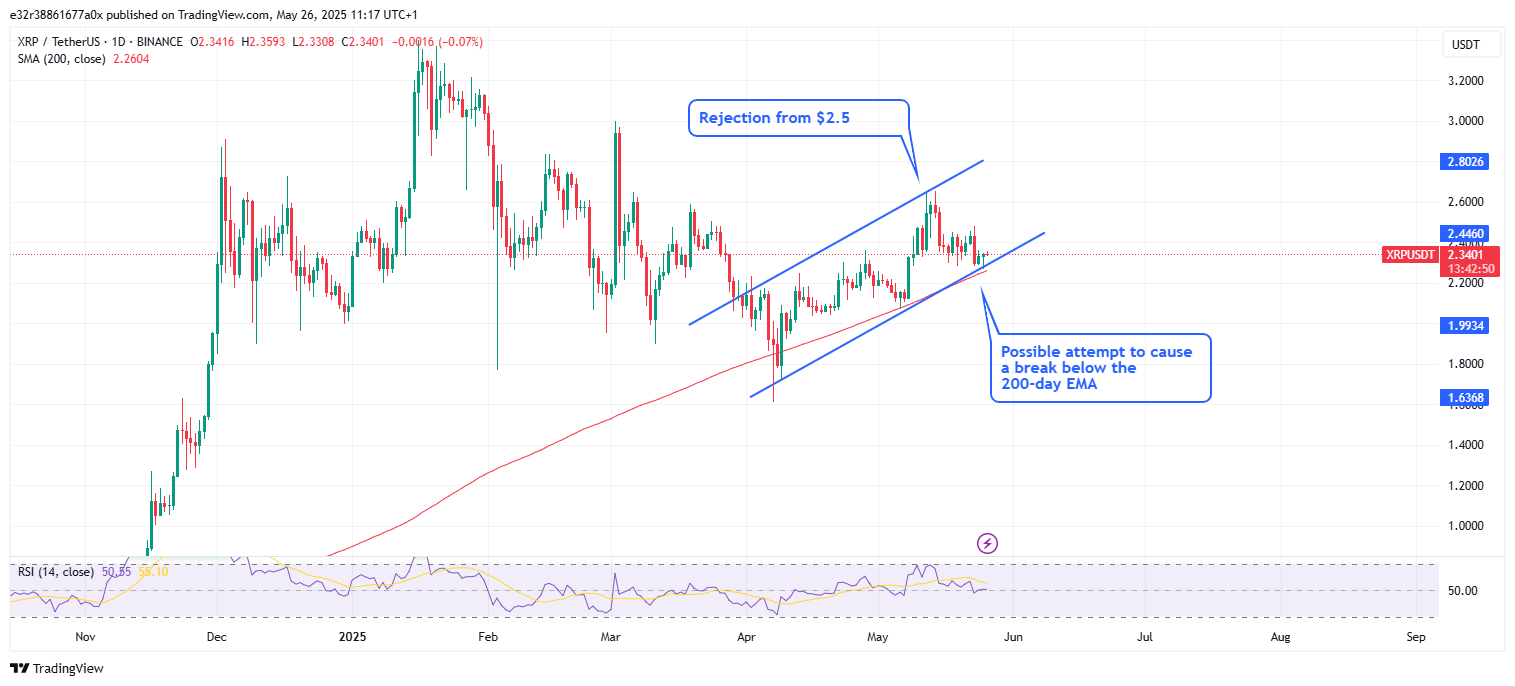
At the time of writing, XRP was hovering around the $2.33 price level, which corresponds with the 0.5 Fibonacci retracement level. Because of how important this level is, a break above could help XRP regain its footing.
On the flipside, a break below could send XRP lower, with the next support levels sitting at $2.29 (0.618 Fibonacci) and $2.20 (0.786 Fibonacci). It is worth mentioning that XRP also needs to reclaim the $2.42–$2.45 zone as well.
That range has become a short-term resistance, and if XRP manages to push back into this area, it could point towards a return to upward momentum.
A Pennant Pattern and $10 Targets
While short-term technicals are currently showing bearish or neutral patterns, some analysts are seeing a much larger move.
For example, analyst Crypto Yoddha believes XRP is forming a bullish pennant pattern. For context, pennants are a continuation structure that tends to follow a strong breakout.
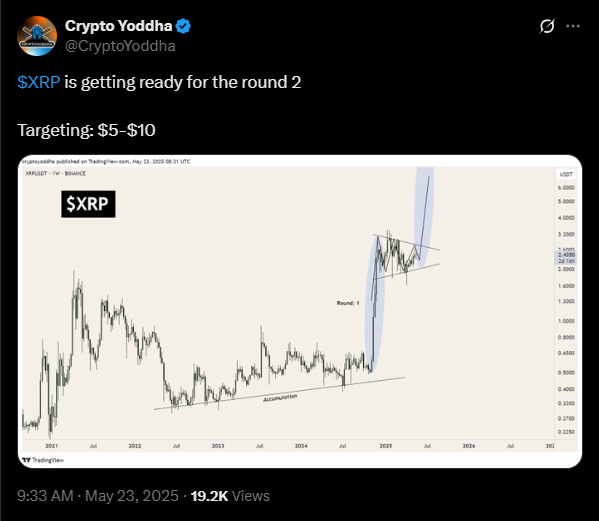
According to Yoddha, the recent price action may simply be “Round 2” of a major rally that started after a long accumulation phase from 2021 to 2024.
XRP broke out above $2 in early 2025, and the current consolidation may be the pause before a bigger move. If this pattern plays out as expected, the cryptocurrency could be on its way towards the $5 to $10 range.
Network Activity Plummets 95% in Six Months
Adding to the ongoing issues is the decline in XRP’s network activity. According to data from XRP Scan, the rates of daily active accounts have dropped from a peak of 105,000 on December of last year, to just 10,900 as of May 25 this year. This stands as a massive 94% drop in less than six months.
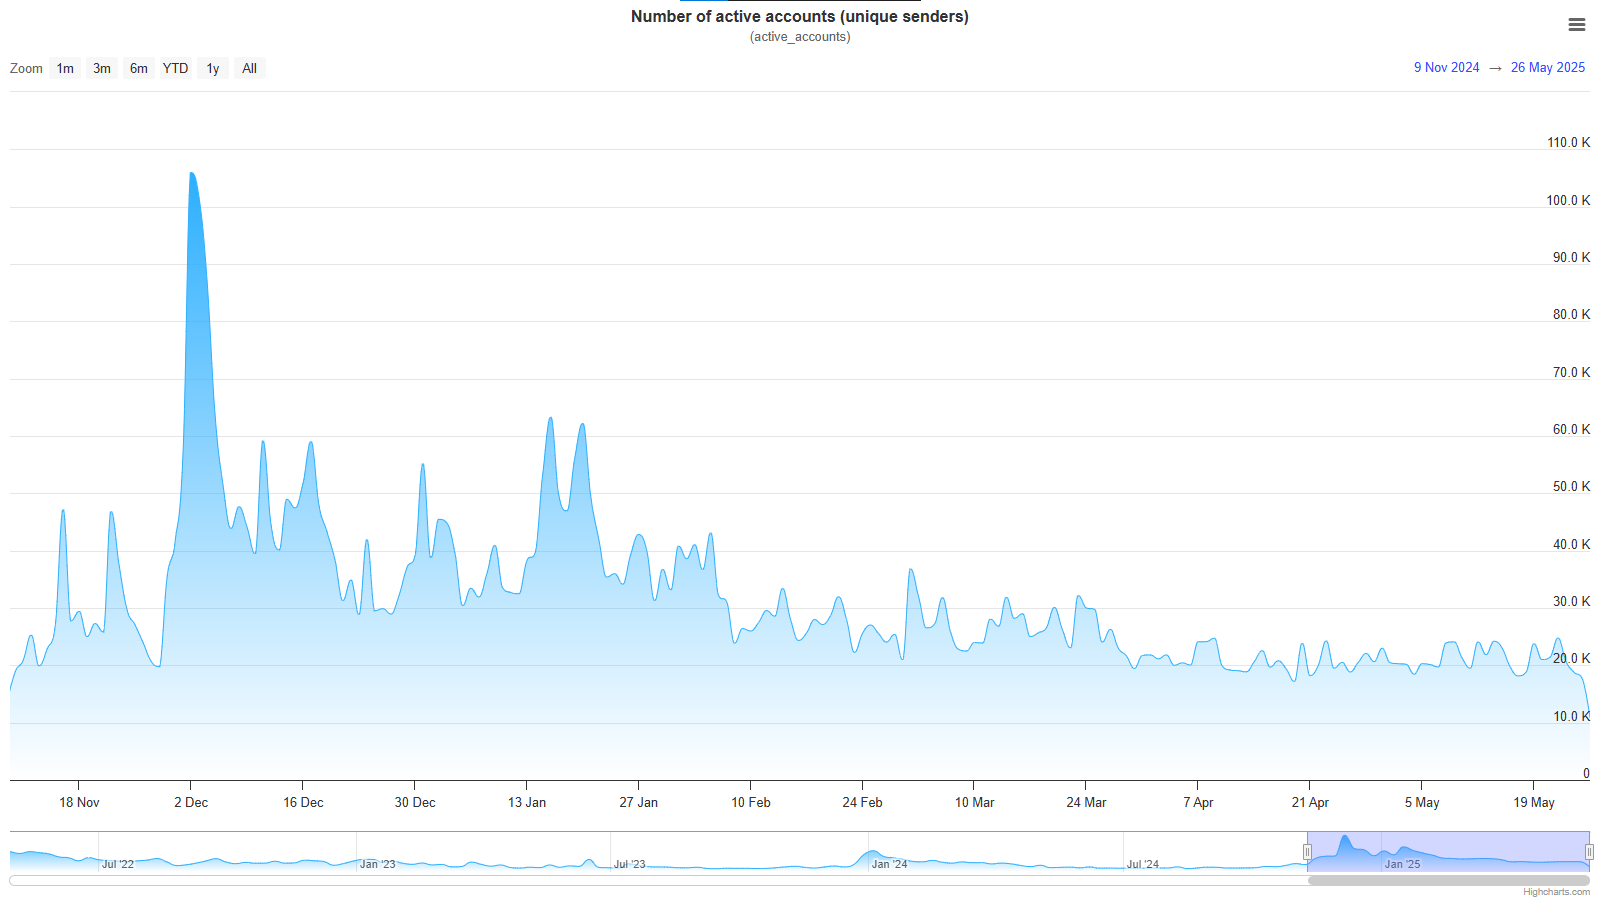
Interestingly, this peak came during XRP’s first breakout above $1 and amid the speculation of pro-crypto administration in the US after the elections.
At the time, excitement over Ripple’s legal battles helped fuel the surge. However, despite progress on this front lately, interest appears to have faded.
What the Charts Say
At the time of writing, XRP was trading at around $2.33 and was up nearly 5.31% in 24 hours and over 0.35% over the week.
According to the charts, the cryptocurrency is now clinging to short-term support at $2.24 while holding above the longer-term base of $1.91. If this support zone near $2.24 holds, XRP could mount another push toward the $3.20–$3.60 range.
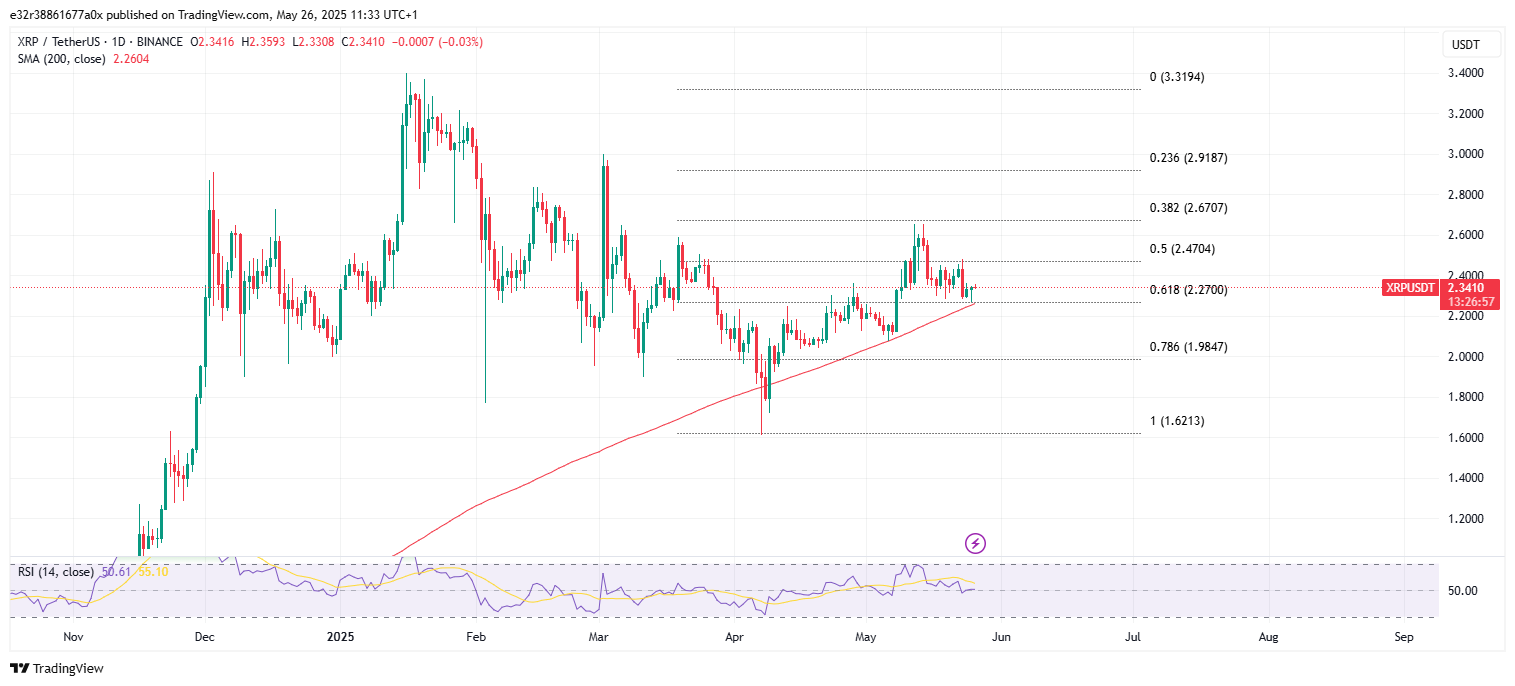
However, any breakdown below $1.91 would be a completely bearish sign, and further decline could follow. Overall, the immediate Support for XRP currently sits at $2.35 (0.5 Fibonacci), followed by $2.29 and $2.20.
The major Support Floor sits at $1.91, and a breakdown below this could trigger a sell-off.
Finally, XRP needs to reclaim the $2.42–$2.45 zone and convert it into support. This would in turn open the doors to upside targets of $2.99, $3.20–$3.60, and then $5 to $10.