
Key Insights:
- Over 70% of XRP’s realized market cap has been accumulated near recent highs.
- Some analysts believe a breakout above $2.40 could lead to a 74% price increase towards $4.
- The immediate future of XRP could either be a 25% decline or a 74% rally.
XRP has enjoyed a mega rally since late last year, after surging more than 385% and catching the attention of traders and analysts across the board.
However, recent developments in both on-chain activity and technical chart patterns show that this rally could be set to cool down even further. At least in the short term.
While some experts predict a bullish breakout soon, others are warning of an incoming 25% decline. Here’s a breakdown of the current state of XRP using market data, technical indicators, and expert insights.
Realized Cap Data Shows Market Top May be in
According to data from Glassnode, more than 70% of XRP’s realized market capitalization has been accumulated near the recent highs.
For context, the realized market cap refers to the total value of XRP, based on the price at which each token last moved. This pattern is not new.
Similar trends have been observed just before major market corrections in 2017 and 2021, and if history is any indication, investors must keep their eyes open.
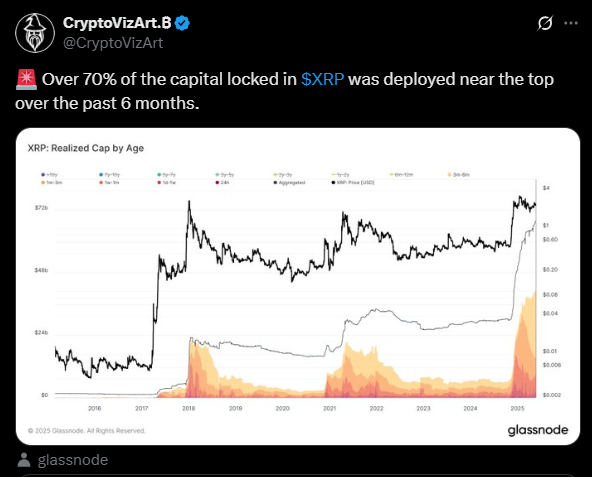
In those previous cycles, large amounts of capital entered the market from short-term holders.
These short-term holders were generally newer investors who were more sensitive to price swings. Considering how these investors often react emotionally during corrections, they triggered stronger selloffs, and in late 2017, XRP dropped nearly 95% after peaking.
The same happened in 2021, when it fell almost 80% following a similar rise in short-term realized cap. This kind of top-heavy market pattern, where most of the capital has recently entered at higher prices, tends to be a problem for asset prices.
It leaves XRP open to sudden price declines if confidence slips further.
Chart Patterns Point to 25% Correction
On the technical side, XRP is currently trading in what appears to be a pennant formation. XRP was rejected from the upper resistance of the formation twice between 12 and 14 May, and now appears to have found support against its 200-day EMA around $2.35. This moving average is a highly important one, and must remain intact for XRP to continue further upwards.
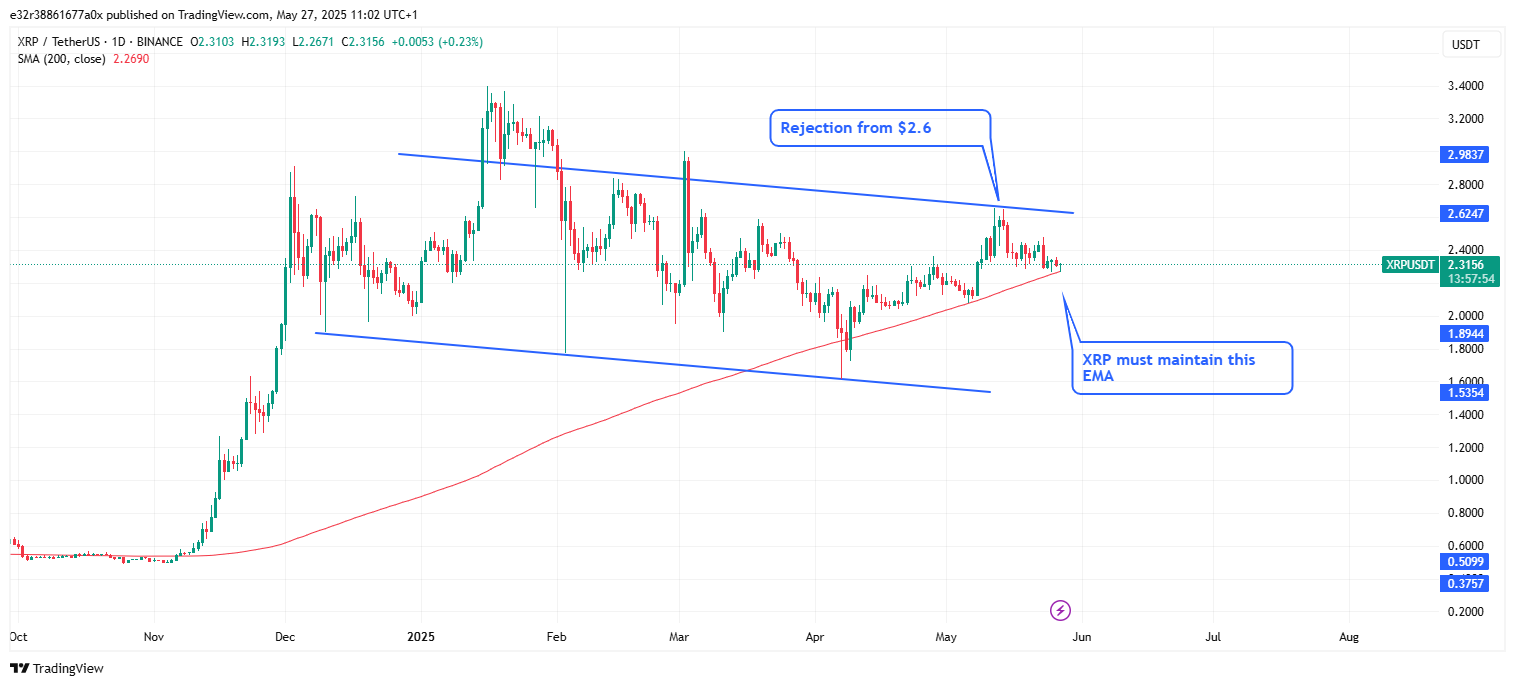
If a break below occurs, the cryptocurrency could be headed towards its 50-week EMA, which sits near $1.76.
This is about 25% away from its current price level, and coincides with the lower boundary of the pennant. This prediction also supports the idea that the current phase may be a correction, rather than the start of a new bullish leg.
What Comes Next?
While the data so far leans bearish, not everyone agrees that the party is over. According to insights from Market analyst Poseidon, XRP is currently in a long-term consolidation phase that may soon resolve to the upside.
The analyst believes that XRP began consolidating in December of last year, after a jump from $0.50 to $2.90 when President Donald Trump won the elections and subsequently took office.
Since then, XRP has fluctuated between $2 and $3. It has also occasionally broken out, but has returned into it due to sharp sell or buy pressure.
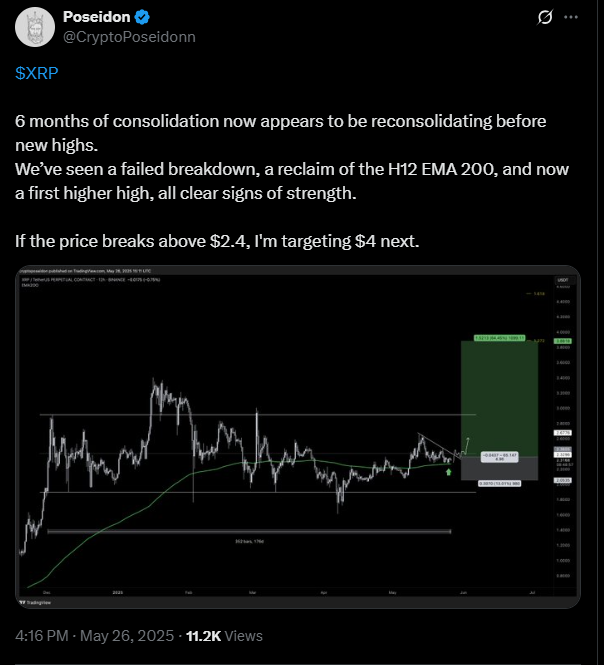
Poseidon believes that a descending trendline has capped XRP’s movements since May 12, when the asset hit $2.60.
Because of this, a break above $2.40 would confirm a breakout from this trendline and set the stage for a move to $4.
That would represent a 74% increase from current prices and mark a new all-time high for XRP. Because of this, XRP could be in for one of two scenarios.
It could either break above $2.4 and notch a 74% price increase towards $4, or break below its 200-day EMA around $2.35 and sink by 25%.