Key Insights:
- XRP ETF approval odds now stand at an impressive 95%.
- SEC engagement signals rising confidence in XRP’s regulatory clarity.
- XRP is approaching a launchpad according to charts, ahead of building anticipation.
The prospects for a spot XRP ETF (exchange-traded fund) in the United States have sharply increased, with Bloomberg analysts now assigning a 95% chance of approval by the U.S. Securities and Exchange Commission (SEC) in 2025.
This new projection marks a pivotal shift in the regulatory outlook surrounding digital asset ETFs and could unlock massive institutional demand for XRP.
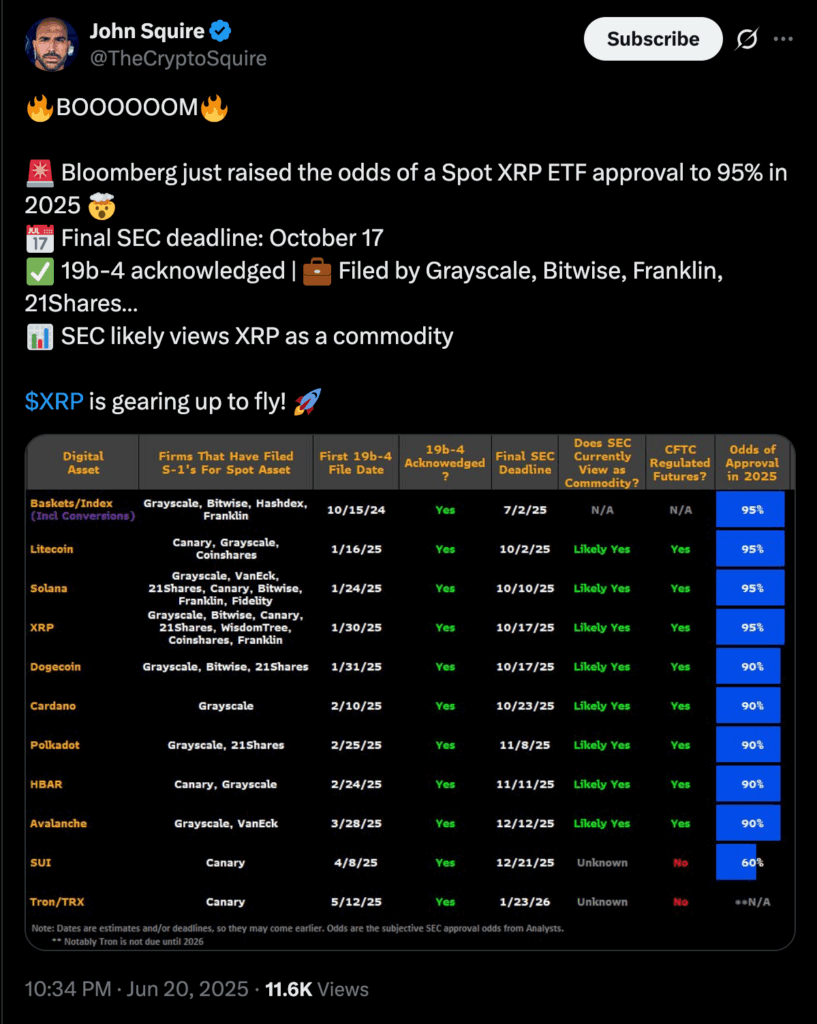
The final decision deadline from the SEC is set for October 17, 2025, according to multiple 19b-4 filings submitted by prominent asset managers, including Grayscale, Bitwise, 21Shares, and Franklin Templeton.
SEC Engagement Signals a Turning Point
The surge in confidence comes as Bloomberg ETF analysts James Seyffart and Eric Balchunas reported increased engagement from the SEC across several crypto ETF applications.
Their analysis suggests that the regulator’s dialogue with issuers is more robust and frequent than in previous cycles, which historically correlates with a higher likelihood of approval.
In particular, XRP’s inclusion in this wave of filings suggests the SEC may be moving toward a broader acceptance of cryptocurrencies beyond Bitcoin and Ethereum.
Seyffart commented on X that SEC interaction is a “very positive sign,” noting that while the timeline remains unclear, the tone of engagement appears constructive.
He acknowledged that final approvals could arrive within the next few months or closer to the October deadline, but emphasized that approvals now seem more a matter of “when, not if.”
A significant factor contributing to XRP’s strong odds is the growing belief that the SEC is inclined to treat it as a commodity rather than a security—a critical regulatory distinction.
This follows the partial legal victory Ripple Labs achieved in its ongoing case with the SEC in 2023, where a U.S. judge ruled that programmatic sales of XRP on exchanges did not constitute securities transactions.
While the legal battle is not entirely over, the ruling has reinforced XRP’s claim to commodity status, aligning it more closely with Bitcoin in the eyes of regulators.
This regulatory clarity is key for asset managers when structuring ETF products. Approval of a spot XRP ETF would signal that the SEC recognizes sufficient legal and market infrastructure to allow for regulated, exchange-traded access to the token, similar to the Bitcoin spot ETF approvals seen earlier in 2024.
XRP Approaches Launchpad Zone Amid XRP ETF Anticipation
Superimposed over the ETF storyline, we now find a necessary technical configuration occurring on the 4-hr XRP/USDT chart published by XForceGlobal.
Per the chart, XRP has finished contructing a long corrective wave, leading to a perfect forging core. Prices reverted back in the golden Fibonacci pocket, between 61.8% and 88.6%, a strong reversal territory.
At press time, XRP value was approximately $2.02. The set-up indicated that the asset was in the tail-end of Wave (2), which is a typical retracement period followed by a massive take-off of the Elliott Wave Theory.
The expected Wave (3) aims at a relocation substantially higher than the $4.00 level. This is why it may rise to $6.00 in the future.
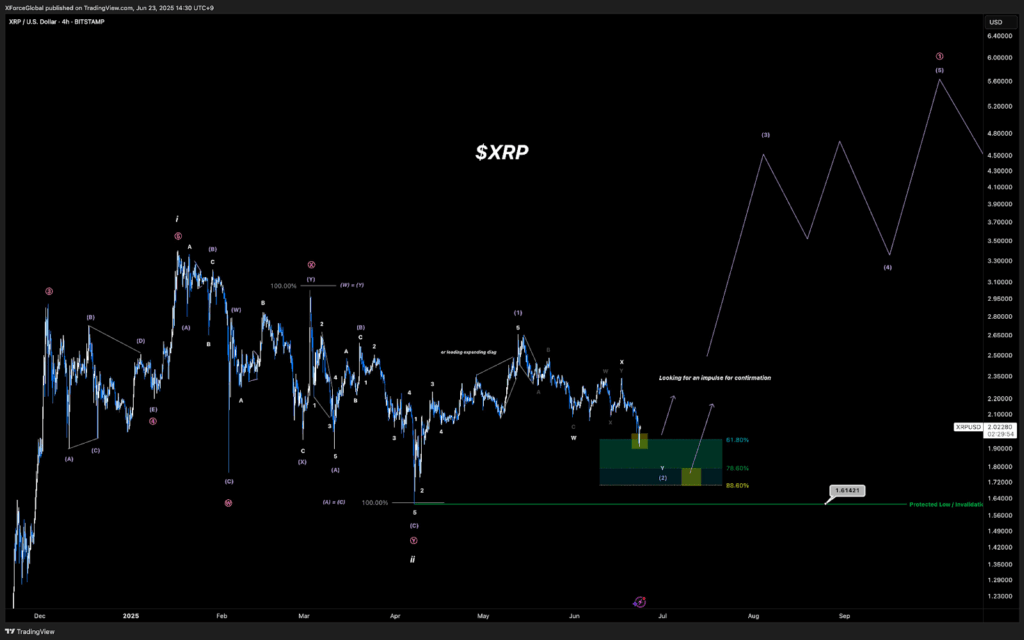
Despite the gut-level fear of a deeper correction, the market is not testing critical support at 1.61, that is, the point labeled as Protected Low.
So long as the price remains in the territory above this zone, the bull thesis stands, and the validation is the formation of a strong impulsive move out of the Fibonacci zone.
As the final SEC decision deadline for a spot XRP ETF approaches on October 17, 2025, optimism is surging.
Bloomberg’s 95% approval forecast, driven by increased regulatory engagement and institutional filings, represents a paradigm shift for XRP and the broader altcoin market.
With technical indicators aligning with the fundamental narrative, XRP is poised for a pivotal moment that could reshape its trajectory and the landscape of regulated crypto investment in the US.
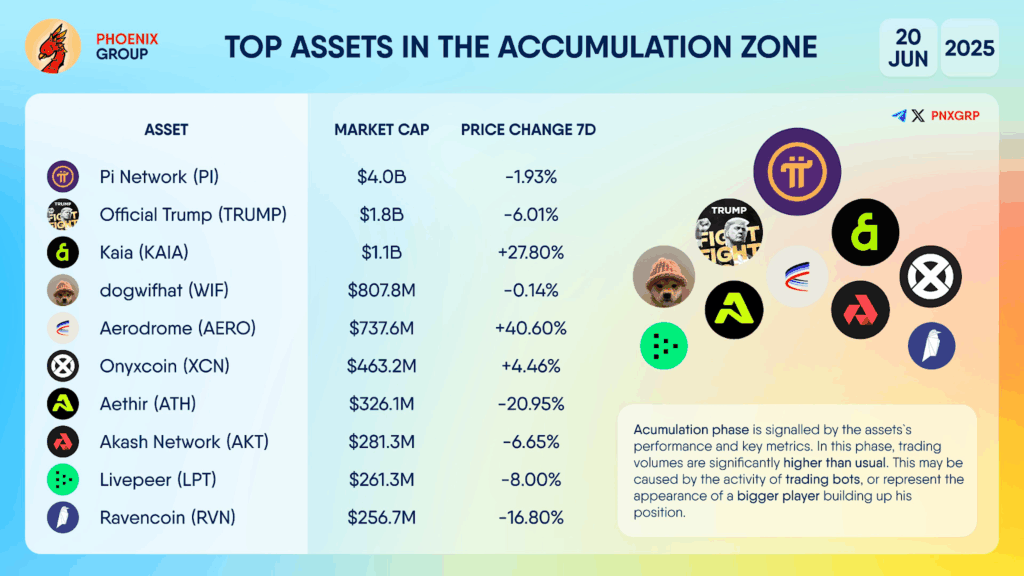
 Signals Accumulation as Breakout Indicators Intensify")