Home Blog

Mid-Term Holders Bleed—But XRP Holders Are Still In The Green

0

Key Insights:

  • XRP is the only major cryptocurrency profitable for holders who bought between December 2024 and January 2025.
  • XRP maintains a 2% year-to-date gain despite losing its January rally highs.
  • Data from Glassnode shows that XRP holders in the three to six-month range have at least 11 percent unrealized profits.

The cryptocurrency market has entered a correction phase as most assets trade below their recent highs. Data shows that only XRP has delivered positive returns to holders who purchased between December 2024 and January 2025. Meanwhile, mid-term holders of Bitcoin, Ethereum, and Solana deal with significant unrealized losses.

XRP Leads as Mid-Term Holders Profit

XRP stands out in a largely declining market, with data confirming profitability for holders within the three—to six-month range.

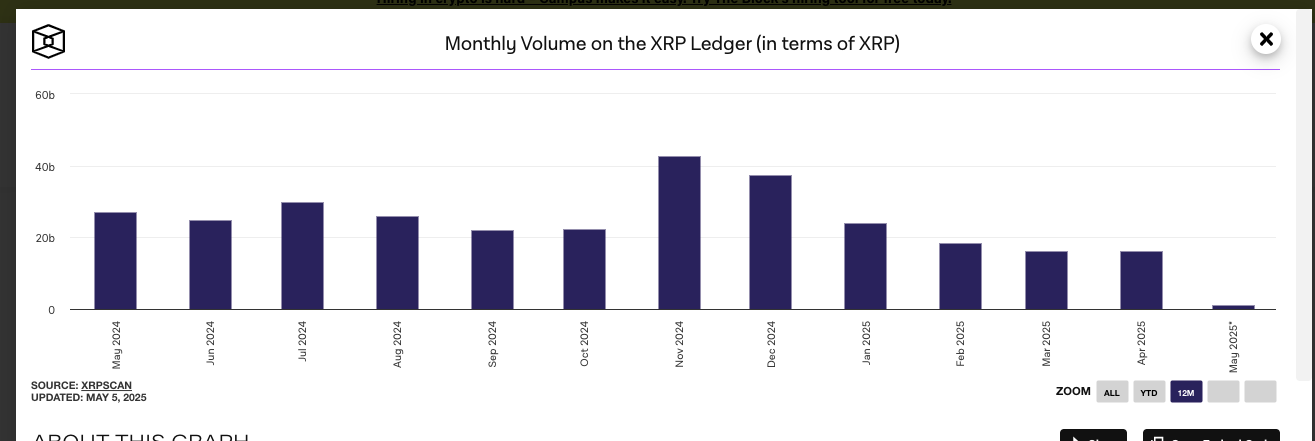
The asset reached its maximum of $3.399 in January, after which it dropped. However, it is still 2% up this year since it began.

Although it has lost the gains of its January rally, it has protected profitability for the bulls that had previously been seen.

The broader market had a cooldown, but XRP remained stable above its cost basis, at least for recent buyers.

According to Glassnode metrics, the addresses that bought XRP in the bullish wave currently have at least 11% unrealized gains. This strength creates some pressure to sell and flexibility for accumulation.

Furthermore, in the same situations, XRP comes out on top in the data, as the asset boomed among peers.

Even at its current price, which appears to be a retracement, it has commanded a higher average price than buyers’ entries. Hence, XRP provides its owners with more stability amid prevailing market uncertainty.

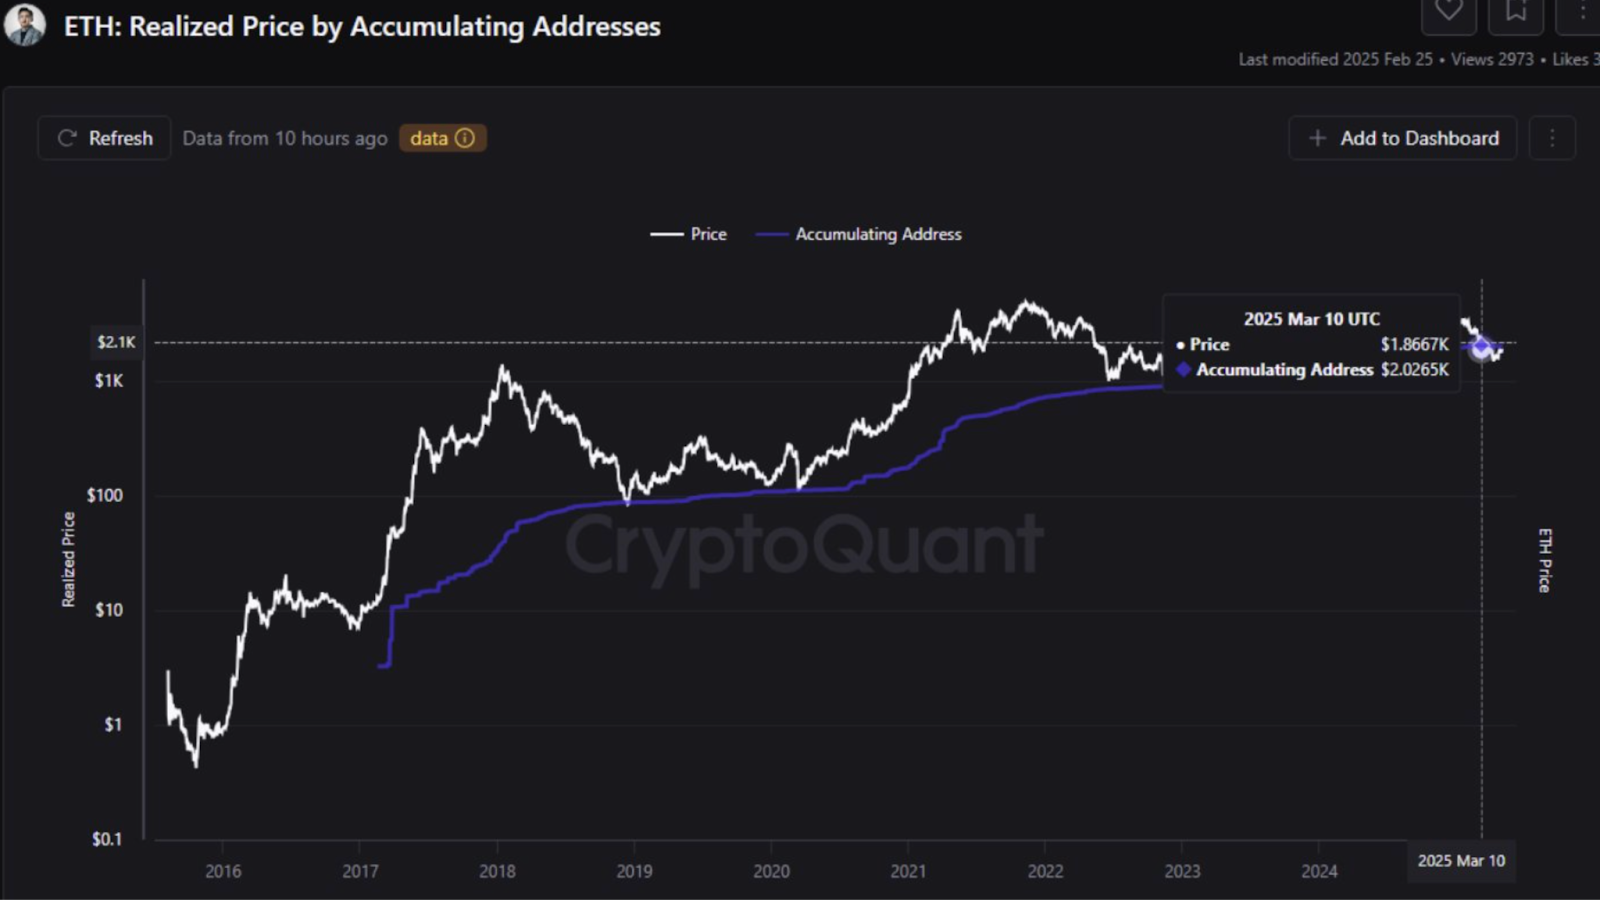
Ethereum Trades Well Below Key Support Levels

Ethereum has experienced its mid-term holders move into the negative, as the current price and entry levels differ by 36%.

The asset oscillates at $1,800, unable to maintain the momentum achieved in the December and January bull runs. This retreat indicates greater troubles brewing with Ethereum’s recent weakness.

While Ethereum’s price action suffers, addresses from December to January come with unrealized losses.

The decline has gone beyond the simple retracement, with recent trends indicating a bearish sentiment that may continue for longer. Therefore, this pressure may also cause more people who entered during the last peak to exit.

Unlike XRP, Ethereum is failing to provide a hook for buyers who got on board when the prices were rising.

Market sentiment is still mixed, but Ethereum demonstrates limited strength as well. As such, the existing range between entry and present prices is still a serious issue for this group of holders.

Solana Sees Sharp Declines in Mid-Term Profitability

Solana has also performed poorly, as evidenced by the significant 28% price decline noted from the mean entry point of mid-term buyers.

The token hit its high earlier in the year and now trades around $146, meaning it is far below the cost from late 2024. This implies a price structure for those who bought in the bullish cycle.

The statistics show that Solana’s market has not grown effectively under the current selling pressure. Mid-term addresses have also become significant paper losses as the asset could not regain key resistance levels. This trend is among many on a long list of vulnerabilities observed in many altcoins.

Also, the mid-term losses indicate low confidence among participants, beginning in December and continuing through January.

Unless there is a recovery, further selling is possible for Solana. The currency’s current state starkly contradicts XRP’s capability of maintaining value under similar market pressure.

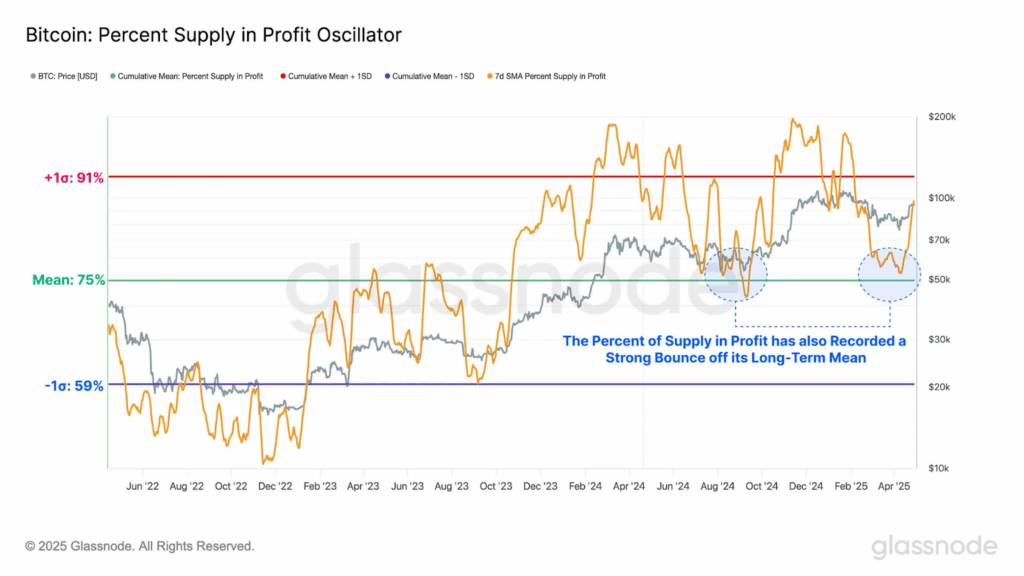
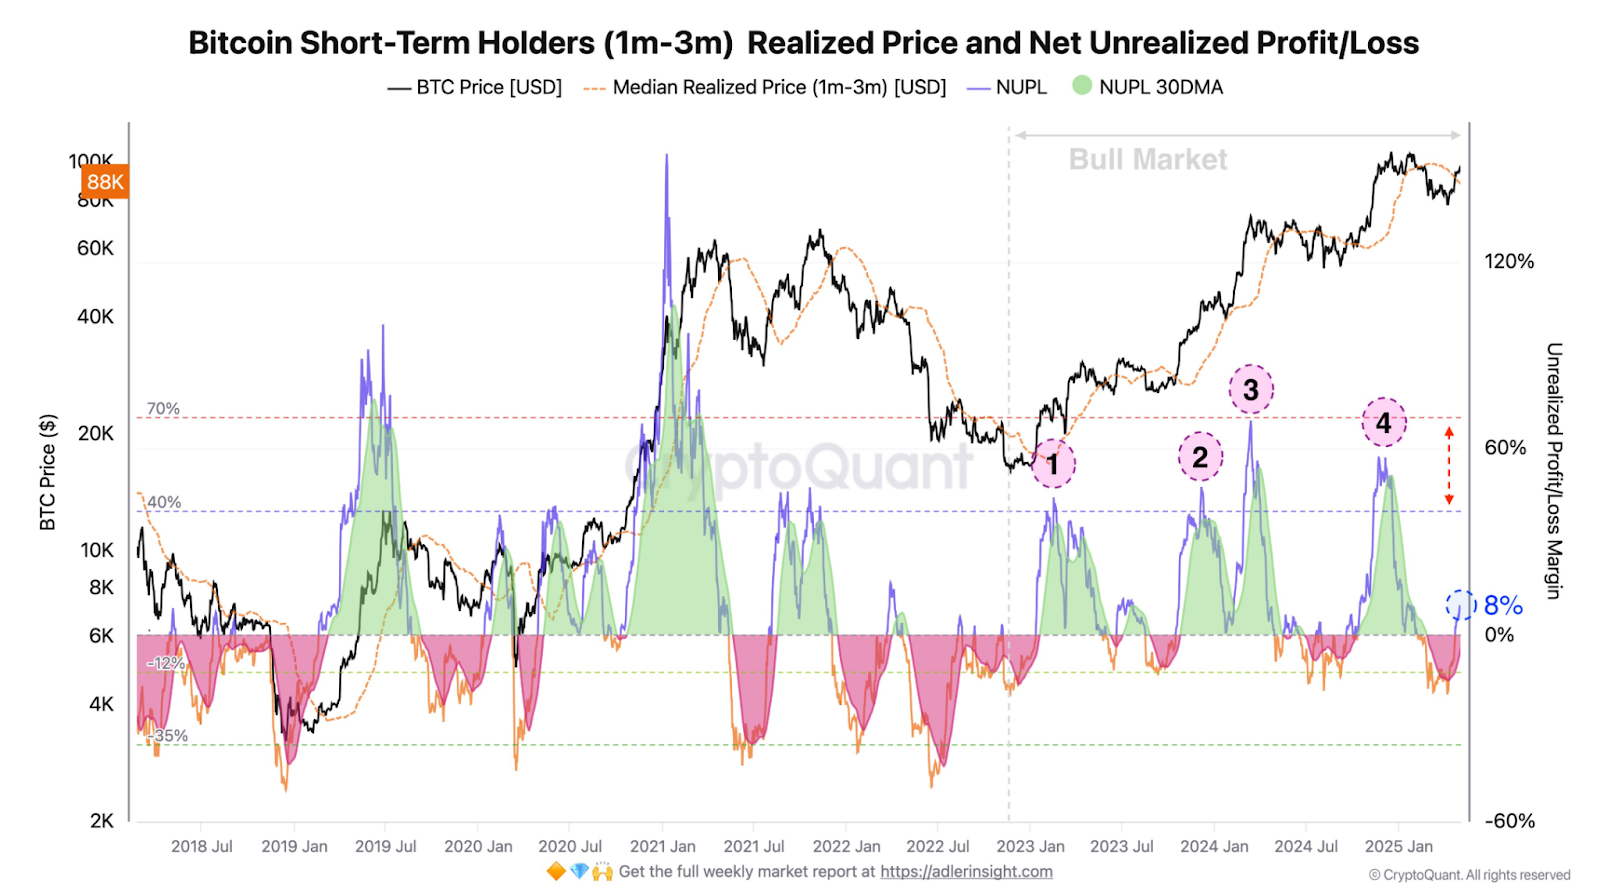
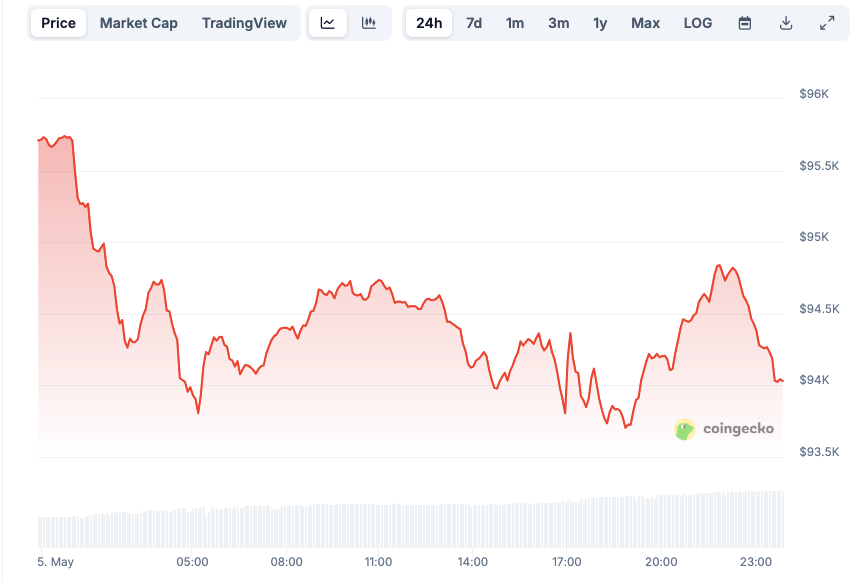
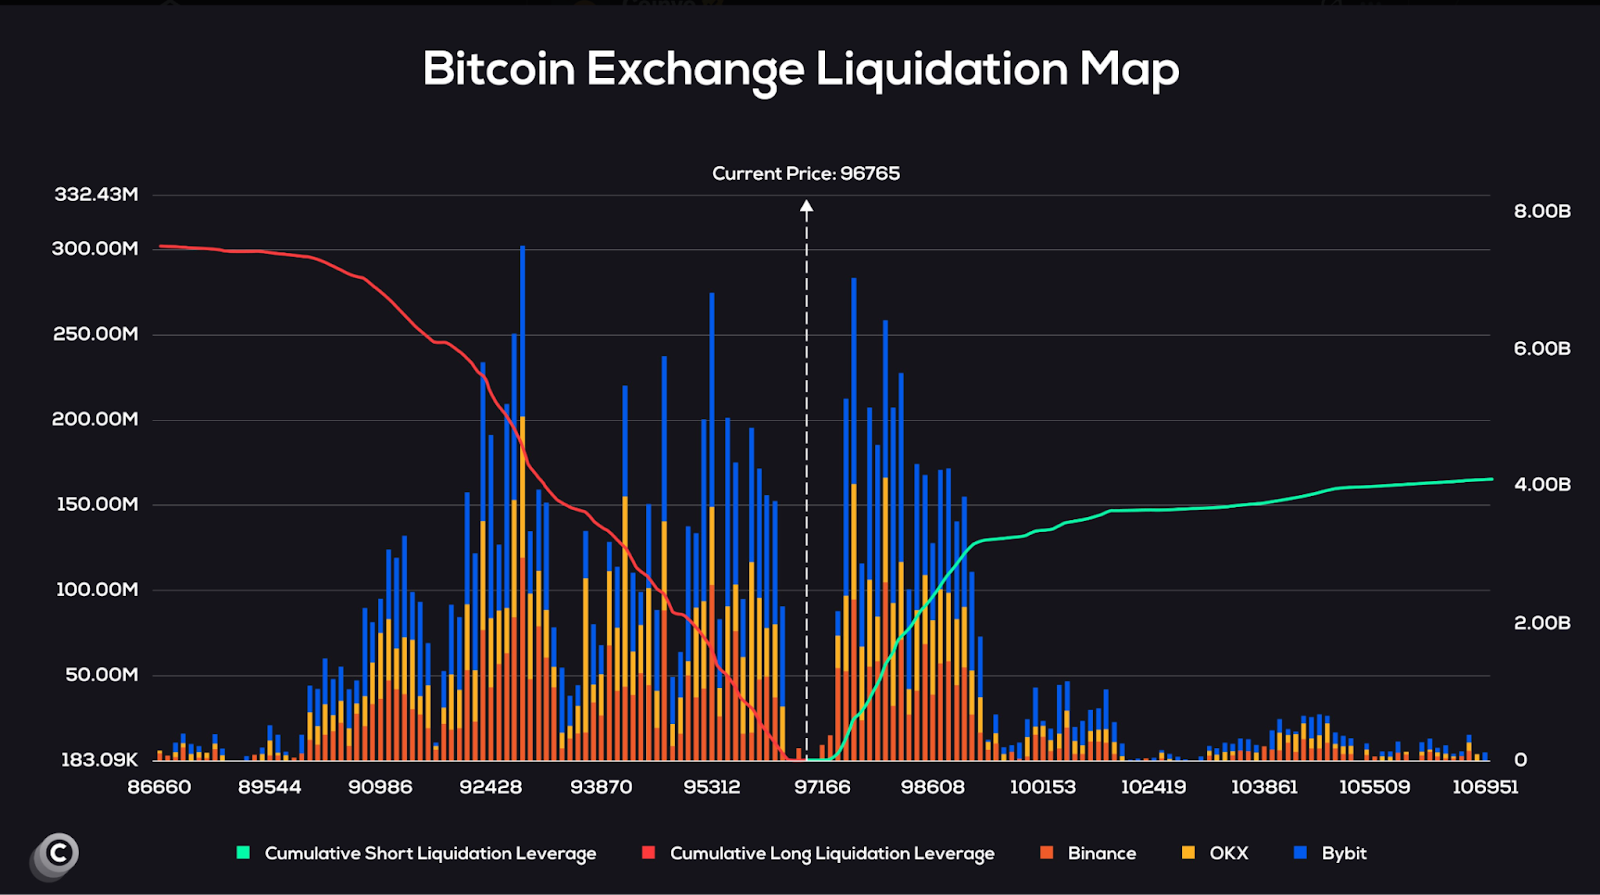
Bitcoin Stays Near Cost Basis but Shows Less Strength

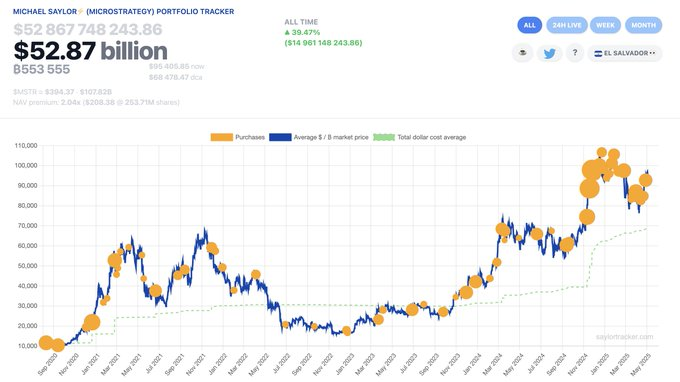
Bitcoin has fluctuated slightly below its three-to-six-month cost basis, around $95,000. Though not too far away from the entry-level for mid-term buyers, it is not very profitable for several of them. We have failed to show a strong upward movement in the recent market action.

While Bitcoin did recover 12.7% from the April lows, it has failed to sustain breakthrough momentum.

Near $97,000, the resistance keeps the gains in check, limiting returns for short—and mid-term investors. However, long-term build patterns still suggest an advantage for possible upsides.

Glassnode’s analysis indicates they will still face until Bitcoin breaks the current resistance level. Although there are temporary spikes, the price requires a sustained increase before it turns profitable for this segment. Meanwhile, Bitcoin’s future looks more reserved against XRP’s more advantageous stance.

Ex-Celsius CEO Begs For Leniency—Can He Escape A Decades-Long Fate?

0

Key Insights:

  • Alex Mashinsky will be sentenced on May 8 for crimes related to the collapse of Celsius Network.
  • He pleaded guilty in December 2024 to commodities fraud and manipulating the price of CEL tokens.
  • Prosecutors are asking the court to impose a 20-year sentence for his role in the scheme.

Alex Mashinsky, former CEO of Celsius Network, will be sentenced on May 8 for crimes linked to the platform’s collapse.

In December 2024, he pleaded guilty to commodities fraud and market manipulation, admitting he profited $48 Million. Prosecutors have sought a 20-year sentence, while his lawyers requested just over one year in prison.

DOJ Says Mashinsky Caused Massive Harm

The US Department of Justice (DOJ) accused Mashinsky of willfully causing destructive harm to thousands of Celsius platform users. Hundreds of testimony statements submitted to the court showcased the substantial financial damage and strong emotional harm affecting thousands of Celsius users.

The prosecution maintains that Mashinsky deceived his users into losing their retirement savings, their homes, and their psychological well-being.

The DOJ claims Mashinsky deceived customers regarding Celsius’s financial state and seized his assets during this deception.

Law enforcement classified his deceptive actions as premeditated conduct, which pursued his financial success with deliberate deception. The DOJ wants punishment to account for the offense’s gravity and the victim’s loss value.

The victims who pursued compensation recounted bankruptcy and depression, together with family-related suicides, as among their lasting effects. Many people who supported Mashinsky with their life savings now say he deceived and misled them.

According to the DOJ, the administrator’s sentence would generate damaging consequences throughout digital financial markets.

Mashinsky Lawyers Request One-Year Term

The defense presented a memorandum arguing Mashinsky was a first-time offender and had achieved thirty years of clean business operations.

Defense attorneys stated the prosecution had overplayed Mashinsky’s part and dead-aimed during Celsius’s operation. His attorneys pointed out his track record of sector leadership and his contributions to technological businesses.

The defense states that Mashinsky lacked the intent to cause damage and did not exercise total authority as the company’s decision-maker. They also maintained that he kept a clean legal record through his first arrest and fully supported legal investigations.

The court documents state that Mashinsky should not accept liability for all Celsius employees’ collective actions.

His defense team contends that the DOJ’s recommended punishment exceeds what should be considered fair and reports that both emotional public sentiment and facts interfere with the process.

The law firm described the government’s depiction of him as a single person to blame while overlooking major industry issues.

The defense recommended that Mashinsky receive 366 days’ imprisonment with supervised release instead of the government’s recommendation.

Victims Demand Accountability for Mashinsky’s Actions

Several victims submitted statements to the court documents expressing their opinions about Mashinsky’s sentencing.

The statements from court attendees asked for severe punishment and recognition of Mashinsky’s involvement and leadership functions. Several investors recognized how widely the crypto market became disorderly as Celsius collapsed.

According to user reports, Mashinsky took a more careful stance than other crypto protagonists while making his mistakes.

A different user claimed that Mashinsky took advantage of defenseless community members to obtain millions of dollars personally. The supplemental comments from users challenged legal teams to find an acceptable legal punishment framework.

Web3 content creators and Celsius users who lost their funds shared their perspectives through social media and legal platforms.

The podcast host agreed with the DOJ’s recommendation to note the enduring distress on victims’ lives and financial challenges.

Various commentators worried that accountable leaders would avoid prosecution while Mashinsky received harsh penalization.

Delays Continue for Other Celsius Executives

Celsius bankruptcy established new historical benchmarks in digital asset failures after creditors received $4.7 Billion in debt. Mashinsky’s conviction and sentencing mark an important enforcement milestone for digital asset regulatory systems.

The court proceedings have become noteworthy because they coincide with longer-than-expected punishment delays for additional former Celsius executives.

Former chief revenue officer Roni Cohen-Pavon accepted similar criminal charges this year, although his sentencing proceedings remain pending.

His sentencing decision was delayed until after Mashinsky’s trial because authorities wanted maximum pressure on the upcoming sentencing.

Legal experts view Mashinsky’s current situation as the benchmark for holding crypto sector participants accountable.

Jay Clayton currently serves as the Southern District of New York’s acting U.S. Attorney, managing the high-profile decision-making process.

Clayton’s time as SEC Chair has been marked by difficulties related to digital finance compliance standards.

VanEck Files BNB ETF—Is Binance Founder The Real Force Behind It?

0

Key Insights:

  • VanEck has filed for a BNB ETF, making it the first proposed exchange-traded fund directly tied to Binance Coin.
  • The filing has raised speculation that Binance founder Changpeng Zhao influenced the decision through his recent comments on crypto reserves.
  • BNB’s price remains around $599.6 and is positioned within a volatile liquidation zone that may lead to rapid price swings.

Asset manager VanEck has filed for a BNB ETF, triggering market speculation and regulatory discussions. The filing happened simultaneously with Binance founder Changpeng Zhao’s recent discussion of national crypto reserves. Industry experts are investigating whether Zhao had a substantial impact on VanEck’s decision.

Eric Balchunas from Bloomberg’s ETF analytics team connected VanEck’s ETF application with Zhao’s statements. VanEck made this move based on Zhao’s advocacy to include BNB in sovereign digital asset reserves. Despite remaining speculative, the timing matches Zhao’s public appearances and bolsters this theory’s acceptance.

The filing about Binance Coin here captures broad market attention because it could represent the industry’s first Binance Coin melody-based ETF. The recent action by VanEck points toward institutional interest but raises important questions about the matter.

Market reactions toward Binance’s structure and regulatory troubles continue to affect perceptions of this development.

VanEck BNB ETF Sparks Influence Debate

The decision by VanEck to file for a Binance Coin ETF exchange-traded fund created intense conversation within digital asset platforms and traditional financial institutions. This filing occurred when Changpeng Zhao started integrating BNB into worldwide digital asset reserve programs. The connection between Zhao and traditional financial institutions has generated speculation about his unknown role in intervention.

At present, Zhao’s BNB adoption suggestion to governmental bodies has possibly led VanEck to position itself in emerging trends before they became popular. The strategic discussions influenced VanEck CEO Jan VanEck’s decision, per Balchunas. The action presents an important example of how structured entities shape unstructured financial resources.

Zhao’s lack of official documentation about his involvement increases the evidence supporting this theory. The focus shifts to how Binance conducts its relationships with global regulators and institutions.

According to the new filing, institutional investment vehicles showcase rising interest in digital currency options that go beyond Bitcoin and Ethereum.

Regulatory Concerns Challenge ETF Outlook

The BNB ETF filing has brought back into focus longstanding questions about Binance’s management structure and regulatory track record. Public skeptics point out Binance Coin’s substantial centralized management as a major factor limiting its eligibility to become a regulated ETF.

The filing has revived worries about Binance’s proper compliance after previous regulatory actions, together with current analysis of its regulatory track record.

Analysts in the market argue that launching a BNB exchange-traded fund would increase regulatory oversight constraints on Binance and its associated operations.

The new filing poses difficulties for U.S. regulatory bodies, which already demonstrate restrained support for crypto security products. Zhao’s involvement in sovereign reserve suggestions creates added regulatory uncertainty.

Critics define the ETF proposal as dangerous because it creates an excessive connection between exchanges and financial products subject to regulation.

Experts warn that exposing classic market systems to vulnerabilities in the crypto revolution could result from this development.

Holding an approval for the ETF represents a crucial step forward in bringing alternative digital assets into mainstream markets.

Potential BNB Price Movements Show Mixed Signals

BNB’s price stagnates around $599.6 despite growing expectations about potential exchange-traded funds (ETFs). The token’s current elevated price point exists alongside fluctuating market sentiments because traders are spread between long and short positions according to derivative market indicators.

Data shows the long/short ratio crossing above 1.1, demonstrating growing long position engagement despite short dominance on the market.

BNB Long/Short Ratio
BNB Long/Short Ratio Chart | Source: CoinGlass

BNB tokens continue to show accumulated demand in spot market exchange transactions since they remain in net draw.

Multiple Spot Inflow/Outflow data months showed red bars indicating low token exchange inflows. ETF developments encourage market participants to move BNB off of exchanges through sustained withdrawals.

BNB Long|Spot Inflow/Outflowt
BNB Long|Spot Inflow/Outflowt | Source: CoinGlass

Technical examination of exchange transaction data confirms intense market engagement near price points $570 and $630 because they act as significant buying and selling pressure areas.

Highly leveraged traders face major liquidation risks when operating near the marked BNB/USD thresholds on the liquidation risk map. When prices cross either zone it triggers major liquidations and high short-term market turbulence.

Liquidation Map Highlights BNB Danger Zones

The BNB/USD liquidation map shows distinct price areas that could trigger sudden forced liquidations of positions.

Short position liquidations concentrate beneath $570, and long position risks exist above $630, creating a restricted zone of elevated risk.

If prices drive outside either boundary point, the futures market will experience a cascade of events.

Binance BNB|USD Liquidation Map
Binance BNB|USD Liquidation Map | Source: CoinGlass

The risk levels extend from $565 up to $575, and $625 through $640 become more hazardous when employing leveraged positions at 10x and 15x.

If these levels are crossed, the price levels host substantial open interest that will generate excessive market volatility. The increased leverage pressure produces conditions that could trigger sudden price movement.

Solana Whales Strike Again—Is A Massive Price Breakout On The Way?

0

Key insights:

  • SOL Strategies and DeFi Dev Corp have jointly acquired 200,000 SOL tokens, signaling substantial whale accumulation.
  • SOL Strategies purchased 122,524 SOL worth $18.2M as part of its $500M capital deployment plan.
  • The firm used a $20M tranche from its ATW convertible note facility to fund this latest acquisition.

Two major Solana whales have expanded their holdings with significant token purchases. SOL Strategies and DeFi Dev Corp jointly acquired 200,000 SOL.

These signals continued substantial accumulation and potential price implications for Solana amid rising trading activity.

SOL Strategies Makes $18M Solana Purchase

SOL Strategies has purchased 122,524 SOL, boosting its Solana ecosystem footprint. At an average price of $148.96, the purchase was valued at $18.2 Million. It is the first of three planned tranches of the $500 million it intends to invest.

The company’s goal is to increase its validator network and deepen its stake in Solana’s infrastructure. It secured the SOL allocation through a recently launched ATW convertible note facility. The $20 Million inaugural release from that facility provided funding for this specific acquisition.

With that move, SOL Strategies now holds a total of 391,782 SOLs, presently valued at just shy of $55.6 Million.

The company’s ambition is to scale further on the back of future tranches from its capital raise. It takes a focused approach to ensure long-term accumulation and operational expansion.

Staking Strategy Drives DeFi Dev Corp Move

Following suit, DeFi Dev Corp bought 82,404 SOL for $11.2 Million. This latest acquisition drops the firm’s holdings to 4,009,091 SOL. The tokens, on the other hand, would be allocated to staking using the firm’s validator infrastructure, the firm confirmed.

The company said these tokens were meant to help sustain the company’s staking operations and strengthen its yield-based offerings. DeFi Dev Corp’s move to follow this trend keeps SOL Strategies in catch-up on acquiring Solana.

Their strategy mimics a tactic of hyper augmentation in the rapidly emerging Solana ecosystem.

The competition for validator stake leads to speculation of a rival of both firms. The companies now have a combined 791,873 SOL. They may grow their influence in Solana’s proof-of-stake (PoS) consensus.

Solana Price Holds Strong Despite Dip

Despite the size of the purchases, there did not appear to be a big immediate reaction in Solana’s market price. According to CoinMarketCap info, SOL is down 2% over the last day and is trading around $143. Nevertheless, gains continue to exceed 24% per month.

The SOL price remains green, with market demand hovering above the $140 level. Daily trading volume went up 18% to $2.41 Billion, suggesting the growing engagement of large and retail holders alike.

Meanwhile, Solana’s network activity is firing on all cylinders, with the Solana-based project, PumpFun, overtaking Ethereum in fee generation. Related to this, we see strong on-chain traction, which could fuel upward momentum.

Despite whales seemingly providing a thorn in the side for crypto enthusiasts and causing pain to early investors, that behavior could also suggest positioning before a larger move, following positive sentiment around broader network usage.

Dormant Bitcoin Whales Awake—$324M in BTC Moved After a Decade

0

Key Insights:

  • Two long-dormant Bitcoin wallets became active and moved a total of 3,422 BTC worth approximately $324.2 million.
  • Wallet 1NWPS transferred 2,343 BTC after being inactive for 10.5 years, marking one of the largest whale movements in years.
  • Wallet 1PiEK moved 1,079 BTC after nearly 11.75 years of inactivity, continuing a trend of decade-old wallets reactivating.

Two long-inactive Bitcoin wallets have reactivated after more than a decade, moving a combined 3,422 BTC valued at $324.2 Million. The transfers occurred early Tuesday morning and reflect one of the largest whale reactivations in recent years.

The reason for the movement remains unclear, but it has raised speculation across the digital asset community.

Bitcoin Wallet Reactivates After 10 Years

Wallet “1NWPS” executed a Bitcoin transfer worth 2,343 BTC, equating to a value of about $222.2 Million under current market prices.

The wallet sat vacant throughout 2014, following a period when Bitcoin prices rested under $1,000. The movement represents the conclusion of years of inactivity.

Spot On Chain identified this transaction on its on-chain tracking platform as statistically abnormal because it came from wallet “1NWPS.”

The wallet owner remains unidentified, yet the wallet’s reactivation has intensified public interest. Market actors believe the movement points to profit-taking because current Bitcoin prices are favorable.

These funds remained off-exchange, indicating that a sale transaction has not occurred. The data reveals that the transaction was either a security-related upgrade or an internal funds relocation. The present data limits analysts’ ability to determine the purpose of this transaction.

Old Bitcoin Holder Moves Large BTC Amount

Another Bitcoin wallet, “1PiEK,” held 1,079 BTC worth an estimated $102.5 million for nearly 11.75 years before the transfer. In early 2013, Bitcoin reached its initial value but experienced massive depreciation from its current market price at the time of the wallet’s most recent activity. This wallet joins numerous others in an expanding trend where extended inactive holders reengage with their wallets.

The wallet owner takes advantage of current price rates based on the wallet’s size and timing behavior. The BTC has not reached an exchange or a known trading desk yet. These activities suggest both a careful reordering of asset holdings and non-diversification events.

The wallet movement occurred when the Bitcoin address operation decreased throughout this period. Historical records show that early Bitcoin adopters are now transferring their funds because their profitability numbers are improving.

The trajectory of this trend remains unclear, though the total amount moved has shown an abrupt upward shift.

Long-Held BTC Reenters Market Strongly

CryptoQuant’s data reveals that dormant Bitcoin activity has grown by 110% since last year. Data shows that between January and March 2025, more than 62,800 BTC older than seven years shifted to new wallet addresses.

The market growth in Bitcoin between Q1 2024 and Q1 2025 reached a 110% increase after BTC spread from 28,000 to 62,800.

The substantial transfer of legacy coins demonstrates robust portfolio evolution and reflects investor confidence growing in the market.

User wallets have been dormant for over ten years and have been seen across multiple wallet transactions over the last three months. One wallet activated in late March transferred 3,000 BTC from a 2016 acquisition worth $250 Million.

Last month, 50 BTC with an initial purchase price under $0.10 actively moved on the network after lying dormant for 15 years.

A single transaction’s theoretical return surpassed 93,000,000%, demonstrating the vast extent of capital reservoirs entering the market. Since its origin, Bitcoin has experienced enormous growth, evident through these major marketplace developments.

Bitcoin Profit Ratio Exceeds Historical Average

According to analytics firm Glassnode, current blockchain data demonstrates that profit-oriented investors currently control Bitcoin’s supply.

Most Bitcoin in circulation has gained more value than its initial purchase cost, as software records show that approximately 88% of Bitcoin’s value surpasses its acquisition price.

The biggest losses stem from people who acquired their Bitcoin at market levels between $95,000 and $100,000.

Percentage of BTC supply in profit
Percentage of BTC supply in profit | Source: Classnode

Bitcoin’s Market Value to Realized Value ratio has reached its historical standard point of 1.74. Historically, this market indicator signalsthat major participants adjust their trading positions during consolidation periods. Investors currently have a Realized Profit/Loss Ratio (RPLR) of greater than 1.0.

RPLR data points to increased profit activity and an enhanced market attitude. The rise in owners looking to cash out their gains will likely cause price dips through temporary market selling pressure. Analysis of long-term data demonstrates continuous Bitcoin market participation as capital continues to move into the ecosystem.

SHIB Burn Rate Soars 656%—Major Price Breakout Brewing?

0

Key Insights:

  • SHIB burn activity recorded a sharp increase of 656.15 percent on May 6, signaling intensified supply reduction efforts.
  • Over 16.7 million SHIB tokens were permanently removed from circulation through four separate transactions within 24 hours.
  • The largest burn occurred on May 5, with one wallet removing over 5.5 million tokens in a single transaction.

SHIB burn activity has surged significantly, with a 656.15% increase recorded on May 6. This recent rise follows consistent burn efforts throughout April and May.

While SHIB’s price has slightly dropped, the sharp spike in SHIB burn rate signals growing interest and intensified market action.

Shiba Inu Burns Over 16 Million SHIB

Shiba Inu executed its deflationary plan by deleting over 16.7 million SHIB tokens during 24 hours. Four significant SHIB token burn actions contributed to the price spike between May 5 and May 6.

The sustained token burn operations demonstrate a solid approach to controlling the supply of tokens.

Shiba Inu’s burn transactions
Shiba Inu’s burn transactions | Source: shibburn.com

Wallet address 0x8b15.d4282 transferred 146,543 SHIB tokens to burn address BA-3 as part of the latest SHIB burn event on May 6. The transactions on May 5 originated from three different wallet addresses: 0x541f…886e0, 0x7c58…08ccc, and 0x811b…954f. The wallets implemented 5.6 million, 79,491 and 15,404 token transfers to specific burn addresses.

Regular SHIB burn events operated by the Shiba Inu ecosystem demonstrate its system’s systematic development of scarcity. This protocol launched in 2019 has reduced the existing supply by more than 410 trillion tokens. The project selects a system to actively eliminate significant amounts of tokens without affecting existing market transactions.

Shibarium Launch Boosts SHIB Ecosystem Growth

Through SHIB burning activities, community members actively work to decrease the amount of tokens in circulation.

Activity between individual wallets shows long-term holders participating more actively in support of tokenomics. Shibburn’s transparent platform allows users to track and boost involvement in SHIB burn activities.

Outstanding data indicates that the SHIB supply has limited its number to roughly 589.25 trillion tokens. The current circulating supply of SHIB stands at 584.42 trillion tokens while the supply development continues to minimize the circulating supply.

The regular SHIB destruction operations continuously push the token’s availability toward lower levels according to these metrics.

According to trading statistics, the lack of significant SHIB price growth does not reflect diminishing interest from traders in the project.

The introduction of Shibarium DappStore in late April caused the SHIB price to grow by 9%. Shibarium’s platform creates a safer framework for decentralized application usage while advancing community adoption due to its simple and secure gateway.

SHIB Burn and Staking Cut Supply

The increase in SHIB token burning activity did not stop the token’s market value from dropping by 3.27% within the last 24 hours. The currency is trading at $0.00001262 and possesses a market capitalization of $7.37 Billion.

Supply activity through SHIB burn volumes continues to grow while the token’s market value shows declining trends as these trends diverge.

The 24-hour trading volume increased by 15.64% to reach $140.36 Million. Transaction numbers drive high market volumes, which show growing trade volumes beyond market price movements.

The growing activity level shows investor trust in SHIB burn strategies that are fundamental value growth tools.

The total SHIB sitting in xSHIB stake has reached 4.8 trillion tokens. The staked tokens comprise a considerable portion that remains out of circulation. The staking technique paired with SHIB burn mechanisms, decreases the circulating supply while following the coin deflation objective.

Burn Metrics Strengthen SHIB Economic Model

The SHIB burn strategy follows a regular pattern that helps maintain scarcity for Shiba Inu in the long term.

Rising volume and active community participation sustain an increasing momentum despite changes in surface-level prices. The project’s transparent approach adds credibility while inviting more people to participate.

An increase in burn rate has not yet corresponded with price changes in the past, yet research indicates supply reduction affects prices throughout time.

The long-term potential value of Shiba Inu faces critical assessment because of the 410 trillion tokens that have been destroyed so far. Burning SHIB tightens the dynamics throughout the entire blockchain network.

As recorded on May 6, SHIB’s economic model now heavily depends on burn metrics. The market movement matches the strategic directions, as observed in wallet activities and transaction volume increases.

BTC Must Hold $87.5K Alpha Support Or Risk Deeper Drop To $75K

0

Key Insights:

  • BTC must defend $87.5K Alpha support or face a likely drop to $75K.
  • Short-term holders are not selling—NUPL at just 8%, far from the 40% risk zone.
  • Global liquidity is rising again, fueling potential BTC rally continuation.

Bitcoin is holding on to the critical $87.5K Alpha support level, while historical data suggests a possibility of falling to $75K if it breaks.

At the same time, short-term holders aren’t selling, and increased global liquidity may have more bullish momentum in store for BTC.

Bitcoin Holds Above Key Alpha Support Level

Bitcoin is now trading just above $95,000, holding onto a key support level defined by the Alpha Price model. This model uses layered bands to reflect key on-chain pricing levels, as per data from Alphractal.

Now, the final support zone is the $87,500 price level. Historical data suggests that if it breaks, Bitcoin will likely drop to about $75,000.

Bitcoin alpha price
Bitcoin alpha price | Source: Alphractal

These Alpha levels (Alpha 1 to Alpha 10) are derived from long-term fractal behaviour and historical on-chain metrics. Alpha 3, is now close to the $87,500 mark, which has been holding strong since early 2025.

Bitcoin has not fallen below this level since breaching it in mid-April. This is something traders should keep an eye on. The update warns that if $87,500 breaks, “there’s a very high probability we’ll also lose the $75K level.”

Short-Term Holders Show Minimal Selling Pressure

Another key indicator in the current market is the behaviour of short-term holders, those holding Bitcoin between one and three months. Institutional traders and speculators using ETFs are often these investors. They tend to sell when profits exceed a certain level, putting pressure on the spot market.

Bitcoin short-term holders
Bitcoin short-term holders (1m-3m) realized price and net unrealized profit/loss | Source: CryptoQuant

As of now, their Net Unrealized Profit and Loss (NUPL) is at just 8%, and the 30-day simple moving average (SMA) is still negative at -2%. This is far below the usual 40% level at which this group typically begins to sell.

This cohort is not actively taking profits yet, according to the data. During these expansion periods, Bitcoin’s price has tended to climb, as was the case in 2019 and 2020–2021, following similar liquidity growth.

Looking at the patterns from 2018 to 2025, every time the NUPL has crossed 40%, Bitcoin has had a pause or correction right after. Because current levels are so much lower, these holders are not likely to sell immediately, and further upside could continue.

Long-Term Alpha Trends Suggest Strength

The historical data from the Alpha Price model suggests that Bitcoin is still in the healthy long-term range. Looking at a broader chart of Bitcoin since 2010, it’s obvious how the asset has always respected the Alpha Price bands in all previous bull and bear markets.

Bitcoin alpha price
Bitcoin alpha price | Source: Alphractal

Bitcoin repeatedly bounces off lower Alpha bands and climbs back to the upper bands in the chart. There has been a peak near Alpha 1 or Alpha 2 in each cycle. In May 2025, Bitcoin is trading closer to Alpha 2, historically a mid- to upper boundary during bull markets.

Another tool from Alphractal, the Alpha Oscillator, is also below the red zone, which in the past has signalled price tops.

The oscillator is at level 6, below the overbought range of 8 to 9. That implies that the market has not yet peaked.

Liquidity Trends Align With Bullish Momentum

Global liquidity is another supporting factor. Another chart from Coinvo shows global M2 money supply growth from central banks such as the Federal Reserve, ECB, GBM, CNM and JPMorgan. Historically, Bitcoin price has tracked increases in global M2 liquidity.

Bitcoin and M2 growth
Bitcoin and M2 growth | Source: Coinvo

Global liquidity began growing again as of early 2025. After a period of contraction in 2022 and 2023, M2 growth year over year is becoming positive.

Previous bull runs in 2016–2017 and 2020–2021 have seen Bitcoin’s price climb during these expansion periods, as the previous bull runs also followed similar liquidity growth.

Four clear macro cycles are also seen on the chart. They all start during or just following a spike in global M2 growth. The current increase in liquidity hints that another such cycle is underway. If M2 keeps rising, Bitcoin could continue its run higher, provided it holds above the critical $87,500 support zone.

VanEck Files BNB ETF With SEC—Could This Trigger A Price Breakout?

0

Key Insights:

  • VanEck has filed for the first-ever spot BNB ETF with the SEC, signaling increased interest in altcoin ETFs.
  • The filing follows VanEck’s previous move to create an AVAX ETF, showing its broader focus on altcoin-based products.
  • The BNB ETF application comes amid a surge of over 70 active altcoin ETF filings currently under SEC review.

VanEck has officially filed for a BNB ETF with the SEC, marking the first attempt at a spot ETF for Binance Coin. The filing reflects a growing push among asset managers to bring altcoin ETFs into the mainstream amid recent market optimism.

As interest in crypto ETFs grows, attention is now turning to whether BNB could benefit from this momentum.

VanEck’s BNB ETF Move Marks New Altcoin ETF Era

VanEck submitted the necessary documents for a BNB ETF after registering a statutory trust in Delaware a few weeks ago. The company continues to demonstrate stability in its altcoin market strategy by taking a similar action after establishing an AVAX ETF earlier. The BNB ETF filing arrives during a surge in similar applications, with over 70 altcoin ETF proposals now in progress.

vaneck bnb etf
Source: sec.gov

The BNB ETF stands out due to BNB’s large market cap and established presence in the crypto ecosystem. BNB’s position seems unaffected by the uncertainty surrounding the approval since the broad exchange network continues to expand.

The application filing continues the forward momentum in the overall altcoin ETF movement, regardless of SEC guidelines.

Various market analysts predict the SEC will issue decisions about these ETF applications during October.

The BNB ETF is unlikely to be decided in the near term, but market participants are already reacting. The current regulatory climate shows better conditions than when exchanges delisted BNB.

BNB Gains Momentum After ETF Filing

The announcement of the BNB ETF coincided with renewed optimism across the crypto market and strategic appearances by industry leaders.

CZ of Binance, along with Jan Van Eck, took part in Token2049 but did not schedule panel participation or arrange direct interactions at the event.

Certain statements made during the conference suggested that Binance might collaborate with VanEck.

Despite Binance’s past legal issues in the U.S., the BNB ETF filing shows the firm’s renewed interest in American financial products. A few US-based platforms halted their BNB support operations during 2023 due to regulatory nuances.

Reestablishing BNB trading on Kraken alongside other platforms transforms public opinions about its authenticity.

This filing aligns with prevalent industry developments at the same time. The effective launch of Bitcoin ETFs enabled additional altcoin products to enter the market.

As the regulatory climate evolves, the BNB ETF could be among the first to benefit from this shift.

Minimal Buying Pressure Seen in BNB Price

BNB closed at $598.44 on May 5, gaining 2.12% on the day amid rising attention to the BNB ETF news. The token shows confined price movements since it has failed to achieve a substantial breakout from this cycle. Potential market transformation can occur from ETF filing timing as momentum builds in the marketplace.

The present technical market signals show a neutral market state. The Relative Strength Index (RSI) measures 50.48 percent, but the RSI-based moving average reaches 52.28 percent.

Market sentiment shows neutral trends because purchasing and selling power remain equal in the current market conditions.

BNB/USD 24-hour price chart
BNB/USD 24-hour price chart | Source: TradingView

The Moving Average Convergence Divergence indicator displays bearish characteristics because the MACD line rests at 0.50 while the signal line stands at 1.17.

A histogram reading of -0.67 indicates weak downward momentum, even though cross-moves might happen soon. This setup could lead to a bullish crossover if the BNB ETF news drives more activity.

According to the +0.07 reading of the Chaikin Money Flow indicator, BNB shows minimal buying pressure. A value above zero generally reflects capital inflows, and this small gain may become significant if the BNB ETF news accelerates demand.

The trend remains weak at present, but it might change swiftly due to decisive regulatory developments.

BNB Futures Show Prolonged Bearish Bias

Coinglass data shows that funding rates for BNB perpetual futures have remained negative since March. Shorts pay the longs over time because of this funding rate pattern, demonstrating bearish market expectations from traders using leverage.

Market sentiment includes bearish and bullish opinions, according to the occasional funding rate positivity shown in the data.

BNB OI-Weighted Funding Rate
BNB OI-Weighted Funding Rate | Source: CoinGlass

The market indecision is evident in the stable pattern of Open Interest (OI) numbers. Participants are waiting for more substantial triggers, and the BNB ETF could be that catalyst. As news circulates, attention may return to whether BNB can break through its recent resistance.

Will ETH Resume Its Rally as Whales Quietly Stack More?

0

Key Insights:

  • Whales resumed ETH buys, with 1,700 ETH withdrawn from Binance in a fresh $3.1M move.
  • ETH inflows to accumulation wallets hit record highs, signaling rising long-term confidence.
  • Ethereum’s May 7 Pectra upgrade brings one-tap swaps, token gas fees, and biometric access.

Ethereum may be gearing up for a fresh rally as whales quietly return, and accumulation wallets hit record highs. At the same time, the May 7 Pectra upgrade is set to boost usability and mainstream appeal, possibly reigniting demand amid long-term price support and technical strength.

Whale Accumulation Returns After Six-Month Pause

Ethereum has seen renewed whale accumulation as one large holder resumed buying after a six-month break.

According to Lookonchain, this investor withdrew 1,700 ETH, worth $3.1 Million, from Binance just three hours ago. This move has pushed the whale’s total ETH holdings to 5,000 ETH, valued at around $9 Milion.

$ETH
Source: Lookonchain

Although the wallet shows an unrealized loss of $3.6 Million, the new purchase suggests renewed confidence in Ethereum’s price. Most of this whale’s previous activity occurred nine to ten months ago, with multiple large ETH inflows from Binance hot wallets.

The return to accumulation may reflect changing expectations around price movement, especially as key upgrades and institutional interest grow.

Inflows Into Accumulation Wallets Hit New Record

Supporting the whale activity is a sharp increase in ETH inflows into accumulation addresses. Data from CryptoQuant shows a surge in inflows to these addresses, reaching levels never seen before. The recent spike is visibly marked on the chart, showing a steep rise in the volume of ETH moved to long-term holding wallets.

Ethereum inflows
Ethereum inflows into accumulation addresses | Source: CryptoQuant

This activity often signals that holders are moving coins off exchanges to hold for longer periods. These patterns are usually seen when investors expect a future price increase. The chart reveals that previous accumulation spikes often preceded major price recoveries or continued bullish trends.

While ETH’s price has remained under pressure in recent months, the consistent rise in inflows may show rising long-term interest despite near-term uncertainty.

New Ethereum Upgrade Set to Launch May 7

Ethereum is also preparing for a key upgrade called “Pectra,” which is scheduled to go live on May 7. This upgrade focuses on user experience and includes features such as one-transaction swaps, bundled actions like deposit and borrow, and dApp spending caps. It also introduces seedless wallet recovery, gas payments with tokens, and even biometric approval options.

These changes are expected to make Ethereum easier and safer to use. Developers and users have long pointed out that the current process of managing wallets and transactions can be complex.

By improving usability, Pectra could attract more mainstream users and developers. This may increase the use of ETH in decentralized applications and raise demand for the token.

Ethereum also remains the leading platform for tokenizing real-world assets (RWA). As stated in a recent post, “Ethereum continues to serve as the primary hub for RWA tokenization.” This is supported by the ecosystem’s maturity, strong developer base, and infrastructure reliability.

ethereum remains main hub
Source: X

Large financial institutions and platforms are increasingly using Ethereum for tokenising assets like real estate, bonds, and equities. This keeps Ethereum at the center of blockchain adoption in traditional finance.

As more assets are brought on-chain, the demand for ETH as a base settlement asset could continue to rise.

ETH Price Sits in Historical Buy Zone

Technically, Ethereum has reached a level that some analysts refer to as a long-term buy zone. A log regression chart from TradingView shows ETH touching its lower trend band, which has historically acted as a key support. Similar touches in the past were followed by long rallies.

ETH is now priced near $1,800 and sits just above the lowest curved support line on the long-term chart. Previous market cycles show that when ETH taps this zone, it tends to reverse direction and start climbing.

ethereum usd
Source: X

Though past performance doesn’t guarantee future results, the alignment of technical support with increasing accumulation and upcoming upgrades provides context for renewed whale interest.

Will LINK React As Chainlink Rolls Out Rewards With Space & Time?

0

Key Insights:

  • Chainlink has secured over $20.4 trillion in transaction value across blockchains.
  • 100M SXT tokens to be claimed by LINK stakers starting May 8 during Season Genesis.
  • LINK trades at $13.55, down 3.87%, but shows strong long-term support near $14.

Chainlink has locked in more than $20.4 trillion in total transaction value across its network. The adoption is from the official Chainlink dashboard across different blockchains.

As a decentralized oracle network, Chainlink provides essential infrastructure that delivers real-world data to smart contracts.

https://twitter.com/Xfinancebull/status/1919225538222453227

Although Chainlink’s token is gaining popularity, LINK is under short-term market pressure. At the time of writing, LINK is trading at $13.55, down 3.87% in the last 24 hours, according to CoinMarketCap.

The price drop has also led to an increase in daily trading volume to $268.45 Million, which is up 33.51% from the day before. Market capitalization stands at $8.91 Billion.

Strong Base Around $14 Support is Seen on Monthly Chart

On Binance’s monthly chart, LINK has been on a steady uptrend since 2018. The token respects a long-term support trendline, as per the chart. By May 2025, this support is still intact.

chainlink usd
Source: X

Analysts describe the pattern as ‘coiling,’ where price tightens before a move. Yet, there has not been a breakout yet. Targets are marked around $663 and $2,254, but these are not expected short term as resistance levels are far above.

Despite market fluctuations, LINK continues to build within a broader upward trend and holds key structural levels.

Chainlink Rewards Program Debuts With SXT Token Distribution

In other news, the new rewards initiative from Chainlink is aimed at engaging its ecosystem participants.

Chainlink Rewards is a program that lets eligible LINK stakers claim tokens from partnered projects. Space and Time is the first to participate in the network.

As a part of this launch, 200 million SXT, or 4% of Space and Time’s total SXT token supply, has been allocated to Chainlink stakers.

The first phase, Season Genesis, will become available on May 8, 2025, and 100 million SXT will be available for claiming. The claims will be open for 90 days.

https://twitter.com/chainlink/status/1919391686158877086

The remaining 100 million SXT will be distributed in later phases. The next campaign may also return any unclaimed tokens from Season Genesis.

It provides a new way to benefit from participation in securing the network for both historical and active LINK stakers.

Long-Term Growth Strategy Backed by Real-World Use Cases

During an interview, Chainlink’s co-founder Sergey Nazarov spoke about a broader trend of RWA tokenization. Banks are now starting to look at ‘another wave of securitization,’ but this time in the form of tokenization, he said. According to him, it was a “watershed moment” for blockchain.

This development is positioned at the center of Chainlink. The network provides reliable, secure data feeds to automate tokenized asset markets. It also includes pricing, settlement conditions and external data validation through its oracles.

At the same time, the Build program, which underpins Chainlink Rewards, is growing. In exchange for technical support, market exposure, and early product features, projects join Build. In turn, a portion of their token supply is locked up in the Chainlink community.

LINK’s Price Reaction to Network Growth Awaited by Community

The new initiatives and real-world growth haven’t been enough to stop LINK’s short-term price from being under pressure. Yesterday, price fell from $14.15 to $13.55. On CoinMarketCap, the 1-day candle shows a steady downward slope after a short peak.

However, Chainlink’s ecosystem still grows. The rewards program may tighten token supply over time by increasing staking participation.

As more Build partners join future reward campaigns, demand for staking and development with LINK could increase.

First off, May 8 is the date when the first SXT tokens become claimable. During the next 90 days, market participants will most likely pay close attention to staking metrics and price reaction.

Michael Saylor’s Strategy Adds 1,895 BTC—Is A Corporate Wave Incoming?

0

Key Insights:

  • Strategy acquired 1,895 additional bitcoins for $180.3M, continuing its aggressive digital asset accumulation strategy.
  • The company now holds 555,450 BTC, making it the world’s largest corporate holder of Bitcoin.
  • The average purchase price for this latest batch was $95,167 per bitcoin, during a period of price consolidation.

Strategy, previously known as MicroStrategy, acquired 1,895 more Bitcoin (BTC) for $180.3 million this week. Chairman Michael Saylor leads Strategy as the firm maintains its bitcoin purchase strategy through the blinking market volatility. This recent move further advances Bitcoin as the company’s main corporate asset.

The company purchased its latest batch of Bitcoin for an average of $95,167 when Bitcoin prices were stable. The firm’s Strategy currently possesses 555,450 Bitcoin, which makes it the biggest corporate Bitcoin holder. The corporation invested $38.08 Billion into Bitcoin, which averages to $68,550 per coin.

btc price chart
Source: X

The drop in Strategy’s share price by 3.9% did not impair the company’s yearly 14.0% gain from its Bitcoin investments. Bitcoin holds no significance for the company, which maintains its stable perspective on it throughout an extended period. Unrealized profits from its operations have proven its strategic move.

Strategy Maintains Steady Bitcoin Buying Pattern

Strategy’s latest purchase reflects a steady buying pattern since initiating its bitcoin strategy in 2020. The organization buys bitcoin through funds obtained from stock issuances and debt instruments. The company makes its bitcoin acquisitions when the market price of Bitcoin remains relatively calm.

In April, the company executed two major acquisitions worth $1.9 Billion as part of its rapid accumulation strategy. MicroStrategy’s investing strategy follows CEO Michael Saylor’s idea that bitcoin maintains higher value retention compared to traditional financial assets. The strategy has drawn the attention of public companies that analyze the use of digital asset treasury.

The company’s asset portfolio currently holds $14 Billion worth of unrealized gains. This new investment, being smaller than previous purchases, maintains the established pattern of continuous expansion in the company’s asset portfolio. In spite of its first-quarter earnings failure, the company maintained its typical buying trends.

Strategy blends bitcoin holdings with its core software revenue to create a hybrid business model. The company can fund acquisitions by utilizing its portfolio growth and operating effectively in a volatile digital asset market.

The simultaneous use of recurring income and capital investments creates a stable foundation for upcoming business actions.

Semler Scientific Expands Bitcoin Holdings Again

Semler Scientific, which makes medical devices, announced a bitcoin reserve expansion this week as part of a separate business move.

According to documents filed with the SEC, Semantic Ventures Inc. utilized $16.2 Million to buy 167 Bitcoin. The company’s bitcoin holdings now amount to 3,634 BTC, which is worth more than $340 Million.

Semler Scientific devoted $97,000 on average to buy its latest bitcoin coins. Semler Scientific financed its Bitcoin acquisition through a stock offering where it sold 1.166 million shares for $39.8 Million at market value. The company made this purchase as its third bitcoin transaction disclosure within an under two-week period.

Semler Digital Asset has been gradually expanding its holdings in the digital asset market since its initial entrance and indicates through its investments that it will continue growing this segment.

Its total investment of $322.3 Million results in an average purchase price of $88,668 per coin. The recent business move indicates growing acceptance from non-technology companies in adopting digital asset strategies.

Unlike Strategy, Semler has no history of digital asset integration. The corporate world displays a new attitude through Semler’s decision to use treasury money on Bitcoin purchases. According to public documents, the company funded every recent acquisition through its equity capital.

ETH Accumulation Surges 22%—Holders Lower Cost Basis in Confidence

0

Key Insights:

  • ETH accumulation jumped 22.54% from March 10 to May 3, totaling 19M ETH.
  • Realized price dropped from $2,026 to $1,980, indicating strong buy-in at lower levels.
  • MVRV Z-Score nears historic bottom zone, hinting at undervaluation and reaccumulation.

Ethereum holders are stacking more ETH while lowering their cost basis, a sign of long term conviction. In parallel, key valuation metrics indicate ETH is trading close to historical bottom zones, which could present an accumulation driven price recovery setup.

Ethereum Holders Increase Accumulation in 2025

According to CryptoQuant, Ethereum accumulation has risen significantly over the last two months. From March 10 to May 3, 2025, the quantity of ETH held by accumulation addresses increased by 22.54% from 15.5356 million to 19.0378 million. This is a consistent inflow into wallets that have historically not sold often.

ETH cohort analysis
ETH cohort analysis | Source: CryptoQuant

Meanwhile, Ethereum’s price ranged between $1,866 and $1,833, indicating relatively stable price. The fact that buyers are not reacting to short-term volatility is the reason for this behavior. Rather, they seem to be gradually acquiring positions while decreasing their average entry price, or realized price.

Addresses With Lower Cost Basis Accumulate

Investors are averaging into the market, as the realized price by accumulating addresses has decreased.

The realized price for these addresses was $2,026 on March 10, when Ethereum’s market price was $1,866. By May 3, the market price was around $1,834 and the realized price was $1,980.

ETH realized price
ETH realized price by accumulating addresses | Source: CryptoQuant

This movement demonstrates that accumulation is happening at lower levels and that holders are lowering their average cost basis. The lower the risk of a strong selloff, the closer the realized price is to the current market price.

However, when market prices are below the average entry of large holders, pressure to sell usually rises. But, in this case, holders seem happy to keep on purchasing.

Accumulating addresses reduce any potential losses in the short term as they reduce their cost basis. This is a common behavior when there is confidence in a longer-term move.

Ethereum Valuation Metrics Signal Undervaluation

The chart of MVRV Z-Score indicates that Ethereum is currently trading in a zone that has historically marked market bottoms. This is a metric of market value to realized value. It tends to reflect undervaluation when it enters the green band. Again the score is near zero in the current chart.

Ethereum MVRV
Ethereum MVRV Z- score | Source: Coinvo

Dips in the past have occurred in early 2019, mid 2020 and mid 2022. These levels were always followed by strong rebounds each time. In those periods, price also traded sideways before going higher. Both the Z-Score and ETH price have been stable recently with no sharp deviation which usually precedes reaccumulation.

Technical Structure and Candlestick Pattern Support Bullish Setup

Meanwhile, hammer candlestick has formed in April 2025 in monthly charts. It occurs after a downtrend and usually implies a reversal. In the current configuration, the hammer is in an accumulation zone, as was the case in 2019 and 2020.

ethereum usd
Source: X

The price was near the green accumulation band, and in all previous examples shown, price had moved up strongly from past cycle lows.

Ethereum rose over 5,900% after 2020 to an all-time high. Past returns may not repeat, but these structures generally show strong support from buyers.

According to the chart, the current price is $1,825 and the accumulation zone is near $1,400 to $1,800. The setup is also supported by volume, as buying activity rises on the chart.

ETH Holders Show Structural Confidence

Even with market consolidation, Ethereum’s base is still growing. The total balance on accumulation addresses reached 19.0378 million ETH on May 3, compared to 15.5356 million ETH in March. This is a rapid buildup in just two months.

ETH realized price
ETH realized price by accumulating addresses | Source: CryptoQuant

This added ETH was not a reaction to rising prices, as market price remained stable during this time. It was proactive.

These addresses are usually linked to long-term investors. Even if near-term price action remains subdued, their behavior shows increasing confidence in future price movement.

This is a trend of more ETH entering long-term wallets as the realized price moves closer to market price, and this is a reduction in speculative pressure. Ethereum may have stronger price support in the months ahead as long as accumulation continues and realized prices remain near current levels.

XRP Sees $10M Inflows Amid Rumors Of Ripple’s $20B Circle Deal

0

Key Insights:

  • XRP recorded $10.49 million in inflows last week following a previous weekly inflow of $31.6 million.
  • Ripple remains focused due to speculation about a possible $20 billion acquisition deal involving Circle.
  • Total assets under management for XRP-based products now stand at $1.067 billion.

XRP recorded $10.49 million in fresh inflows this past week, reflecting continued market interest in Ripple-based products. This figure comes after a $31.6 million inflow the previous week, signaling a strong upward trend.

Ripple is gaining attention amid speculation about a $20 billion acquisition. The deal reportedly involves Circle, the USDC issuer.

XRP Sees Consistent Capital Movement

XRP experienced growing interest, establishing it as the fifth-ranked digital asset in weekly capital investment. XRP-based products currently hold $1.067 billion in assets. They continue to attract steady inflows as public interest in Ripple’s growth increases.

The recent $10.49 million weekly inflow has revived XRP’s previous momentum. Previously, Ripple had attracted $31 million in inflows during its last surge.

Ripple has expanded its crypto profile through strategy and growing financial interest in its XRP-based products. A total influx worth $256.49 million has reached XRP this year.

XRP Inflows
XRP Inflows | Source: CoinShare

Ripple’s market position is strengthening as it attracts positive fund inflows. This marks its third consecutive week of sustained investor interest.

Multiple digital asset categories achieved solid market performance during this period. Still, XRP alone brought higher weekly figures than other tokens. The rising inflow activity did not prevent XRP from experiencing a 2% value decrease over 24 hours.

Ripple’s Potential $20B Circle Deal

Speculation continues around Ripple’s potential $20 billion deal to acquire Circle, fueling renewed attention on XRP’s market standing. Several reports indicate this acquisition would happen after the failed $5 billion transaction.

Ripple’s $20 billion valuation is still under discussion. Meanwhile, the company has showcased its readiness for major expansion by acquiring multiple businesses.

The financial services company made its largest acquisition in April 2020, purchasing Hidden Road for $1.25 billion. This purchase allowed Ripple to reach more institutional finance companies while reinforcing its asset management services capabilities.

Rumors about the Circle acquisition and the other recent deal confirm that Ripple aims to achieve growth through market consolidation. The market forces strongly react to rumors about Ripple and Circle discussions, even though Ripple holds no official stance.

The combination of Ripple infrastructure with Circle stablecoin technology potentially brings valuable benefits in the long term. Some market experts doubt the likelihood of achieving such a high $20 billion valuation under market conditions.

XRP ETF Approval Hype Drives Sentiment

Approving the XRP Futures ETF has increased discussion around a potential spot XRP ETF. Polymarket data shows approval expectations for the XRP Futures ETF are above 79%.

This prediction is based on forecasts before December 31. The speculation also fuels broader interest and trading volume within the XRP ecosystem.

Ripple ETF Odds
Ripple ETF Odds | Source: Polymarket

In April 2025, the XRP Ledger processed 16.17 billion XRP in monthly transactions, slightly up from 16.05 billion in March.

The increasing level of on-chain operations strengthens the argument for increasing institutional product demand. While ETF approvals for other coins remain pending, XRP is gaining unique momentum.

Monthly Volume on the XRP ledger | Source:  XRPSCAN
Monthly Volume on the XRP ledger | Source: XRPSCAN

XRP’s market narrative is further strengthened by growing support across regions outside the United States. While inflows into Ripple remain led by the US, international activity reflects broader enthusiasm for XRP-linked financial products.

Global Crypto Market Trends Highlight U.S. Dominance

Global crypto inflows reached $1.92 billion recently as the United States continued its position as the leading contributor. German investors contributed $47.2 million to the digital asset product industry.

Meanwhile, Swiss investors provided $34.2 million, and Canadian investors added $20.1 million. Regional market participation was strong but failed to achieve the extensive levels observed in the United States.

Flows by Exchange Country (US$m)
Flows by Exchange Country (US$m) | Source: CoinShares

CoinShares data shows that most markets are seeing increased interest. However, Sweden and Brazil experienced slight cash outflows, bucking the overall trend.

The outflow from Sweden amounted to $0.5 million, while Brazilian investors withdrew $0.2 million from digital asset markets. Hong Kong introduced $2.7 million in assets to the market. Meanwhile, unlisted markets contributed $2.5 million.

The cryptocurrency market has maintained positive growth for three consecutive weeks. Minor regional fluctuations have not disrupted this upward trend.

Short BTC investments saw a $6.4 million increase in value. At the same time, Solana exchanges gained momentum, collecting $6.03 million. The recorded figures specify that investor interest goes beyond premier assets and extends to multiple digital product categories.

Bitwise CEO Says BTC Scarcity Outshines Gold And Fiat Growth

0

Key insights:

  • Bitwise CEO Hunter Horsley compared Bitcoin’s fixed supply with the expanding supply of fiat money and gold.
  • Bitcoin’s annual supply growth is currently at 0.84% and will continue to decrease over time.
  • More than 19.8 million of the 21 million Bitcoins have already been mined. This means less than 6% of the supply is still available.

Bitcoin’s fixed supply is now under sharper focus as global interest in the asset reaches a significant milestone. Bitwise CEO Hunter Horsley recently compared the limited issuance of BTC with the expanding supply of fiat money and gold.

His statement highlights how Bitcoin’s scarcity is becoming a defining factor amid rising demand from public and private entities.

BTC Scarcity Stands Out Amid Demand

The popularity of BTC continues to rise as its supply decreases over time. Growing institutional interest further strengthens its market appeal.

Horsley reported that nearly 19.8 million Bitcoins have already been mined from the total 21 million supply. This leaves only a limited amount of Bitcoin still available for mining. Less than 6% of the entire supply is still available for mining in the future.

This specific model that regulates Bitcoin creation opposes the continuous growth patterns displayed by fiat and gold currency markets. Global fiat currency grows at an annual rate of 14% and 7.4% annually in the United States.

The yearly increase in gold amounts to a rate between 1.5% and 2%. Bitcoin’s current annual supply expansion reaches 0.84%, but this figure will decrease steadily.

The restricted coin release into circulation proves that BTC follows a deflationary model. The growing public awareness about this feature will likely make the scarcity debate more prominent.

Gold and Fiat See Consistent Supply Growth

Fiat currencies grow steadily because central banks implement policies and government spending measures. The worldwide monetary base has experienced a double increase during the last six decades because of these policy changes.

Every ten years, the U.S money supply goes through an expansion period. Very slow, but steady activities in gold mining have preserved its role as a financial storehouse since ancient times.

A 1.5% to 2% yearly supply growth ensures a slow expansion, causing environmental and logistical difficulties. The absolute scarcity of gold is limited because new mining reserves cannot be found.

Bitcoin network utilizes a rigid schedule controlled by the blockchain protocol. The Bitcoin issuance rate follows a programmed reduction due to the programmed four-year halving structure.

The automation system provides complete transparency beyond the standards of both fiat and gold markets.

Institutions Boost Holdings as Supply Tightens

Public companies now buy Bitcoin more quickly than the mining operation can generate it. According to Bitwise, new BTC production will reach 165,000 in 2025 but decrease from historic numbers.

The first quarter of 2025 saw businesses acquire 95,000 BTC, regardless of the projected 165,000 BTC mining output. Strategic entities such as Strategy, Semler Scientific, and Twenty-One continue to rapidly increase their Bitcoin reserves.

The strategic institution Strategy added 15,355 BTC to its reserves, while Semler Scientific acquired 3,467 BTC. Twenty-One has received financial support from Tether and SoftBank as it targets possessing 42,000 BTC.

The additional purchases reduce supply availability in the market, thus causing increased selling pressure. Quick mass buying activity shows that decision-makers are changing their perspective on using Bitcoin as a reserve asset between banks.

Market availability faces increased pressure due to rising institutional demand, which conflicts with decreasing new supply.

Spot Bitcoin ETFs Drive New Demand

Spot Bitcoin ETFs have also seen significant capital inflows this year, reflecting sustained interest in the asset class. The Bitwise Chief Investment Officer, Matt Hougan, confirmed that ETFs obtained $3.3 Billion in funds within a week.

The inflows have spurred additional exposure as financial industry platforms face more exposure. Institutional players have stopped speculating about Bitcoin acceptance because regulated financial tools have conquered widespread approval.

With ETFs attracting consistent demand, Bitcoin’s market integration is entering a new phase. The heightened demand incorporates an additional scarcity factor, strengthening current supply reserve limitations.

BTC|USD|
BTC|USD| Source| Coingecko

The strategy chair, Michael Saylor, states that bank participation in cryptocurrency adoption will boost its adoption rates. The trend of increasing bank interest remains strong even though all institutions have initiated movements.

An escalating demand for digital assets indicates significant changes in the digital allocation market. According to recent CoinGecko data, BTC now commands 64.89% market dominance, the highest level since January 2021.

BTC is expanding in valuation due to rising demand and restricted supply mechanisms. Despite a 1.5% price dip, Bitcoin remains strong in the broader market.

No Danger Yet—Bitcoin’s Metric Still Far From Overbought Territory

0

Key Insights:

  • Bitcoin Cycle Oscillator remains low, signalling no immediate overheating.
  • 83.93% of Bitcoin holders are in profit at the current $94,900 price level.
  • $100K target could trigger $3B+ in liquidations from overleveraged shorts.

Bitcoin’s 2025 rally continues as it trades near $95,000, with over 83% of holders in profit. Even with the strong performance, key market metrics are not indicating overheating. Also, the $100K level is critical as it could cause billions in liquidations and quick price movement.

The Bitcoin Cycle Oscillator Suggests More Upside

The Bitcoin Cycle Extreme Oscillator is used to check if the market is overheating. Values above 3 in the past have indicated a possible correction. Of note, the oscillator climbed above 9 and 12 at the time of previous cycle peaks near $68,000 and $103,000.

This metric is still at a low level, well below the level that has historically triggered sell-offs. It implies that even though Bitcoin had a strong rally in 2025, the market is still not overheated.

It must flash a warning only when the oscillator rises sharply from its current level. Past trends don’t predict future results, but traders often take note when this metric is nearing 3 or higher.

Bitcoin cycle extreme oscillator
Bitcoin cycle extreme oscillator | Source: CryptoQuant

The oscillator had previously hit alert zones in early 2021 and late 2024, which coincided with major tops. In mid-2025, there’s no such spike, which could indicate that there is still room for further movement before any overheating signal appears.

Over 83% of Bitcoin Holders Are in Profit

Meanwhile, Bitcoin is trading at about $94,530, with 83.93% of all tracked Bitcoin wallet addresses in profit at this price level. This comes out to around 16.69 million BTC held by profitable addresses and is valued at around $1.58 Trillion.

At the same time, 7.73% of the wallets (1.54 million BTC, or about $145.79 Billion) are at breakeven. Currently, only 8.34% of Bitcoin addresses with 1.66 million BTC worth around $157.41 Billion are at a loss.

btc
Source: X

This is a strong position for the market. With the vast majority of holders in profit, there is less of an immediate need for them to sell. Those addresses that purchased BTC between $84,549 and $93,735 are now comfortably in the money.

But there is a small segment between $96,904 and $106,839 that may have resistance, as these holders may sell when their position becomes positive.

Many long-term holders are well-positioned as the concentration of green zones is between $6,000 and $85,000. Even as the price nears new highs, this structure can provide stability.

$100,000 May Trigger Over $3 Billion in Liquidations

Moreover, the Bitcoin Exchange Liquidation Map shows high concentrations of leverage just below and slightly above $100,000. As shown, the current price is $96,765. But if Bitcoin rises to $100,000, it could cause more than $3 Billion in liquidations.

Most of these liquidations are overleveraged short positions. Exchanges automatically close these positions when the price is near liquidation levels, and this can create a sharp price move. The price magnet of the liquidation zone can accelerate momentum in either direction.

Bitcoin exchange liquidation
Bitcoin exchange liquidation map | Source: Coinvo

At the moment, cumulative short liquidations are higher than long ones. Stacked short liquidations between $95,000 and $100,000 are shown on Binance, OKX, and Bybit. If price breaks this range, forced buying could take it up very fast.

Forced moves like this are common in volatile markets. Sudden jumps or drops are more likely when liquidation levels are concentrated in a narrow price range. At this setup near $100,000, there is a possibility of a sharp movement if the price pressure continues to increase.

Market Structure Shows Bitcoin in Recovery Phase

On the other hand, Bitcoin is rebounding from a local bottom, according to a recent chart from Titan of Crypto. The structure is a local top followed by a sharp decline, bottoming near late March 2025. The price has been moving upwards again after finding support.

bitcoin usd
Source: X

The reintegration phase is where price recovers lost levels. Often, this phase confirms if the market will continue its trend or if it will be rejected. Bitcoin is stabilising above the key level of $92,000 as of the latest candle.

The reintegration zone between $92,000 and $96,000 is critical. If Bitcoin can hold above this area, it will open the door for a move towards new highs. But if the price were to fall back below $90,000, the market could test lower support levels again.

This structure indicates the market is not overheated and may be set up for continuation. The price action doesn’t look like a blow off top, but rather a healthy recovery. This also aligns with oscillator data and liquidation levels, and for now, it appears to be a steady, upward trend.

Bitcoin ETF Inflows Plunge 40% As BTC Falls Below $95K Mark

0

Key Insights:

  • Weekly inflows to US Bitcoin ETFs dropped to $1.81 billion as Bitcoin’s price fell below $95,000.
  • This marks a 40.8 percent decrease from the previous week’s inflow of $3.06 billion.
  • Despite the weekly slowdown, total net assets across all Bitcoin ETFs increased to $113.15 billion.

Weekly inflows to US Bitcoin ETFs fell sharply to $1.81 Billion as Bitcoin price dropped below $95,000. US Bitcoin ETF funds experienced their biggest weekly decline, reaching $1.81 Billion.

The prior week recorded $3.06 Billion in inflows. Despite this slowdown, total net assets across all Bitcoin ETF funds rose to $113.15 Billion.

During most of April, the investment flow rate demonstrated strong growth. However, this period ended with an inflow decline reaching $1.81 Billion.

Current data revealed a countervailing trend because falling prices and decreasing trading volumes have led to this reduction in activity. Total cumulative inflows reached $40.24 Billion, even though the amount decreased.

The total value traded during May 2 reached $13.23 Billion, down from $18.76 Billion a week ago. The trading volume during daily operations reached only $2.90 billion on May 2.

The trading volume concerning average daily value fell from $3.75 Billion to $2.65 Billion. This indicates a declining market demand.

BlackRock IBIT Leads Bitcoin ETF Market

BlackRock’s IBIT led all Bitcoin ETFs on May 2, recording $674.91 Million in net inflows for the day. IBIT holds $59.64 Billion in net assets, making it the largest Bitcoin ETF fund. It dominates the market with a 52.7% share.

Since its launch, IBIT has amassed total inflows of $43.68 Billion. This solidifies its dominance in the Bitcoin ETF market.

Total Bitcoin Spot ETF History Data
Total Bitcoin Spot ETF History Data | Source: SoSovalue

Despite a dip in daily investment numbers, IBIT continued to grow. Investors have shown a strong preference for large and liquid fund options.

On May 2, the fund earned a price gain of 0.09%, setting it above other competitors. BlackRock’s consistent performance shows stronger results than other ETFs during that period.

Per data analysis, weeks of slower market conditions didn’t suppress the dominant role IBIT plays in advancing its sector growth. The fund continues to draw significant capital inflow while less popular ETFs face difficulties keeping investors loyal.

The increased market faith in BlackRock’s offering demonstrates that investors choose it. However, the market exhibits reduced activity overall.

Fidelity FBTC Holds Despite Zero Inflows

On May 2, Fidelity’s FBTC received zero new investments, demonstrating an end to fund cash inflows. It remains the second-largest Bitcoin ETF, managing $19.28 Billion in total assets as of the latest update.

The fund’s price dropped minimally by 0.02%, yet the trading volume remained stable. Since its inception, the fund has attracted $11.65 billion through continuous capital growth.

Despite lower weekly inflow indicators, the fund continues to hold its position as an essential member among crypto assets. Despite the absence of new daily capital, the fund maintains its position at the top, indicating strength in resisting market fluctuations.

The recent performance of FBTC shows market-wide cooling trends, with its solid asset accumulation going strong. The fund remains inactive as no recent profits have been recorded.

It is waiting for market sentiment to improve or for prices to rise. The fund is a stable mass yet remains inactive regarding new capital additions.

Grayscale’s GBTC Faces Continued Outflows

GBTC under Grayscale has experienced continuous investment withdrawals, totaling—$22.75 Billion since its first launch. Still, the fund remains the third-largest Bitcoin ETF with $18.47 Billion in net assets. The fund demonstrates a strong foundation despite ongoing withdrawal activities.

No investors injected funds while the price stayed stable in GBTC during the observation period of May 2. In contrast to IBIT’s rising investor interest, GBTC continues to receive continuous fund withdrawals.

GBTC maintains strong market dominance because of its prolonged presence in the market and historical positioning. The fund remains stable due to its significant total assets. However, newer exchange-traded funds have outpaced their growth performance.

Outgoing funds from GBTC show changing market preferences. However, investors have not entirely left it behind.

Smaller ETFs Show Mixed Results as Market Stabilizes

Several smaller ETFs showed limited movement during the week, with little change in daily inflows or price. ARKB from Ark has grown significantly, now holding $4.45 Billion in assets. Despite this, it has attracted $2.65 Billion from new investors, reinforcing its market presence.

The total assets under management at Grayscale’s BTC stand at $4.14 Billion because the fund hasn’t seen recent inflows. Despite no new investment on May 2, BITB from Bitwise maintains $3.75 Billion in assets. This indicated its steady retention of capital.

The funds operating at mid-tier levels maintain a steady business without chasing rapid growth. These funds show growth at a slower pace while providing constant support to their assets.

VanEck’s HODL, Valkyrie’s BRRR, and Invesco’s BTCO are among the top ten funds by market capitalization. Their assets total $1.42 billion, $591.40 million, and $524.47 million, respectively.

Valkyrie’s BRRR saw the biggest price decline at -0.08% in daily movement. Meanwhile, BTCO and HODL remained unchanged in value. The operating funds stay stable despite reaching a point of decreased expansion.

Ethereum Mirrors Bitcoin’s Past – Is a Massive Breakout Coming?

0

Key Insights:

  • Ethereum is trading at $1,835 and struggling to break the crucial resistance level near $2,000.
  • The token has rebounded 32 percent from its April lows but remains weak compared to Bitcoin and Solana.
  • Analysts see a bullish setup forming on Ethereum’s chart that closely mirrors Bitcoin’s pattern before its major rally.

Ethereum trades at $1,835, fighting to break key resistance near $2,000 after a 32% rebound since April.

Its performance still lags against Bitcoin, having touched 2020 lows, while it posted a historic low versus Solana.

Yet, some analysts see a potential breakout, as Ethereum shows a similar chart pattern to Bitcoin’s pre-rally structure.

Ethereum Price Struggles to Recover as Bearish Sentiment Persists

The Ethereum price has failed to rise above its previous support after dipping below $2,135 early this year.

Ethereum experienced peak points at $4,086 while developing a bearish double-top chart pattern.

Following support penetration, Ethereum could not continue its price movement above $2,000 despite brief price rises.

Market analysts suggest that Ethereum demonstrates the same chart pattern that Bitcoin displayed before achieving its record-breaking $109,300 peak.

The pattern of two peaks that Bitcoin displayed turned into a double-top, followed by a price drop until it reached $15,522, then proceeded to break through its neckline at $29,361.

The next price direction for Ethereum seems to be aiming for $4,000 or beyond, following its current trajectory.

$BTC & $ETH
Source: X

Price action above $2,135 would create an optimistic long-term trend for Ethereum as it removes near-term resistance barriers.

The resistance level will likely switch sentiment if confirmation occurs above its threshold, which could draw additional buying interest.

The token shows signs of either stabilizing or declining value, since it has yet to surpass key resistance levels.

Liquidation Trends Reveal Market Pressure on ETH

Data from Coinglass highlights frequent spikes in ETH liquidations, especially during major price moves in recent months.

The notable occurrences that indicated high market instability occurred in early December, late January, and early April.

Market price movements during these events forced traders to liquidate their long and short positions because of unexpected market movements.

ETH Total Liquidations
ETH Total Liquidations Chart | Source: CoinGlass

The long period of liquidations on the chart demonstrates that bullish positions have received stronger penalties compared to bearish positions when prices decline.

In late January, Ethereum saw its largest liquidation event, which reflected a sudden drop that liquidated leveraged long traders.

In contrast, short liquidations spiked during mid-February and mid-April, when ETH briefly rallied.

ETH’s price movements between $1,600 and $3,000 over the past six months have contributed to these extreme liquidation events.

The unusually wide price swing affects investors’ trading positions, especially those who employ leverage.

Market unpredictability may cause elevated liquidation activities to persist in any direction, thus influencing price motion.

ETH Chart Mirrors Bitcoin’s Historic Rally

Ethereum’s next move could depend on several external and internal factors influencing this year’s crypto market.

A rebound in Bitcoin’s value could act as a tailwind, supporting a rally across alternative cryptocurrencies, including ETH.

Specialists expect Bitcoin to appreciate substantially, potentially raising its price to $200,000.

Ethereum price similarity with Bitcoin
Ethereum price similarity with Bitcoin | Source: TradingView

On the internal side, Ethereum’s upcoming Fusaka hard fork may provide technical improvements that enhance network utility and boost confidence.

Additionally, Ethereum must regain its market share in sectors such as decentralized exchanges, where it now faces intense competition.

Chains like Solana and Base steadily expand in this area, reducing Ethereum’s dominance.

A shift in the macroeconomic outlook could further support Ethereum’s recovery in the coming months.

The crypto markets would gain strength from positive trade dialogue between the United States and China and any policy changes, including rate cuts.

Ethereum’s chart pattern and technical signals may result in a strong breakout if these factors align.

eToro Eyes US IPO Next Week But Market Turbulence Looms Large

0

Key Insights:

  • eToro is preparing to launch its initial public offering in the U.S. as early as next week.
  • The company delayed its IPO in April due to market volatility triggered by political developments in the US.
  • Improved market stability and gains in comparable platforms like Robinhood have encouraged eToro to reconsider the IPO.

eToro Group Ltd. is preparing to proceed with its U.S. initial public offering as early as next week. In early April the company held off on its IPO because tariff news had created temporary market fluctuations.

However, eToro is now moving forward with renewed confidence, with the market regaining balance.

The Israeli-born trading platform filed a March F-1 registration application with the Securities and Exchange Commission.

The offering was postponed because the company waited during widespread financial turbulence from U.S. market-changing political events.

Now, with comparative platforms posting gains, eToro is reassessing the timing.

With firms like Robinhood gaining over 16% in recent weeks, eToro sees a window of opportunity.

The positive market trends in trading and cryptocurrency induce similar businesses to progress toward new ventures.

The company plans to retry its Initial Public Offering process after delaying it during a short period.

eToro Eyes Strong IPO Backed Recovery

eToro posted a significant financial recovery in 2024, strengthening its case for a public listing. That year, the company generated commissions totalling $931 Million while achieving a net income of $192 Million.

This marked a notable improvement from $639 Million in commissions and $15.3 Million in profit during 2023.

The company maintains a business model based on stock and crypto trading services and social tools for users to replicate the performance of top-rate portfolios.

This unique structure helped eToro recover faster than many rivals amid the broader market shift. The rising interest in crypto services generated additional profits through better margins and increased user engagement.

The IPO plan for eToro receives backing from major underwriter firms Goldman Sachs, UBS, Jefferies, and Citigroup.

eToro’s trading symbol on the Nasdaq market will be “ETOR.” The company wants to achieve a valuation exceeding $3.5 Billion from its most recent private financing round.

SEC Deal Pushes eToro Closer to Listing

Despite favorable financials, eToro faces regulatory pressure as it pursues its U.S. listing. The company completed an agreement with the SEC regarding its unlicensed brokerage operations, settling its $1.5 Million SEC charges by agreeing to restrict some U.S. crypto service operations.

While regulatory scrutiny has clouded the crypto sector, eToro is not alone in navigating this landscape.

Major platforms resolve similar issues within the framework of their public plans. The pro-crypto SEC chair selected in recent months has changed regulatory attitudes towards the crypto sector.

Improved sentiment and looser oversight expectations have helped reduce compliance-related uncertainty for firms like eToro.

Regulatory decisions can potentially modify the scheduling and organizational aspects of listings. Expert observers identify these barriers as the main factors that will influence the success of this IPO initiative.

Bitcoin Boom Fuels IPO Optimism Again

The strength of crypto assets increased through recent months, resulting in higher trading volumes that powered new business operations on different platforms.

Bitcoin trading above $100,000 has energized the entire sector, creating a tailwind for companies like eToro.

The latest momentum has transferred to equity markets, thus raising the interest level for initial public offerings from crypto-linked firms.

Circle Gemini and Kraken’s U.S. public market IPO plans are evolving at an increased speed. The three companies finalized their main regulatory obligations, which positions them for public stock offerings.

The market adoption by cryptocurrency businesses to seek public funding demonstrates this shift toward taking public capital during this favorable environment.

While market sentiment has improved, short-term volatility remains a factor for IPO readiness. eToro must weigh current trading activity against broader macroeconomic signals.

The firm remains closer than ever to a stock market listing, yet may change its release timeline due to market developments.

eToro previously attempted to enter public markets via a special-purpose acquisition company (SPAC) at a $10.4 Billion valuation.

The attempt at public listing through an SPAC received no final validation because market changes combined with reduced investor interest in SPACs.

The company has selected a conventional IPO as its method of obtaining public funding.

Bitcoin Hits 4-Year Dominance High As Fed Moves Remain Unclear

0

Key Insights:

  • Bitcoin’s dominance in the digital asset market has reached a four-year high at 64.89%.
  • The U.S. added 177,000 nonfarm jobs in April 2025, exceeding market expectations of 133,000.
  • The unemployment rate remained steady at 4.2 percent, aligning with previous forecasts.

Bitcoin’s dominance in the digital asset market has reached its highest level in four years, now at 64.89%.

Stronger-than-expected U.S. job data has caused the market to reevaluate expectations about Federal Reserve rate decisions.

The shift in sentiment has strengthened Bitcoin’s position, though future Fed actions remain uncertain.

Strong Job Data Lowers Rate Cut Chances

According to U.S. Labor Department statistics, nonfarm payrolls increased by 177,000 jobs in April 2025.

Job market activity registered 177,000 new positions in April 2025, a slower expansion than the 228,000 additions from March but better than expected figures of 133,000 jobs.

April 2025 saw the unemployment rate maintain the exact level as forecast at 4.2%.

The results show that the employment market maintains an optimistic performance, which supports its enduring stability. Because of this information, the Federal Reserve is less likely to implement immediate rate reductions, and the probability of monetary easing during the near future has decreased as a direct result.

Higher employment statistics lead the central bank to delay their intervention decisions. The market stability of employment creates conditions for keeping interest rates at existing levels.

This development diminishes market demand for speculative assets throughout various market spaces.

The asset market anticipated slow employment growth because it believed it would lead the Fed to adopt a less restrictive interest rate policy.

However, despite recent macroeconomic challenges, the data imply resilience in the labor market. The data indicates that rate cuts might be delayed because of this evidence.

The currency market usually responds positively to stronger employment numbers, which creates additional stress for speculative investment sectors.

High borrowing rates restrict the available capital flow for speculative investments. Since this change occurred, capital investments have diminished from digital assets and most altcoins.

The attention has moved to the upcoming Federal Reserve guidance. Market forces will manipulate short-term asset movements based on signs that central bankers are reluctant about rate changes.

The direction of risk asset prices depends on wider economic indicators because they have not shown any progress.

Bitcoin Dominance Hits Four-Year High

Bitcoin’s market dominance has climbed to 64.89% as of May 2, 2025, marking the highest level since January 2021.

The increase reflects a broader shift toward Bitcoin amid uncertain macroeconomic conditions. The asset demand remains steady despite other digital currencies losing their market share.

Many have turned to Bitcoin as a stable store of value in unpredictable conditions. Unlike altcoins, Bitcoin’s fixed supply and long-term performance attract more traditional capital flows. The asset has surpassed the rest of the crypto market for multiple months.

Bitcoin’s trading price reached $97,026.39, gaining marginally over 24 hours. The market displayed minor changes in movement that demonstrated both continued buying and small selling activities. The market performance indicates that more investors trust Bitcoin as an electronic store of value.

This dominance surge becomes possible because more institutions are involved. Companies and funds continue to direct capital toward Bitcoin, often reallocating from other digital assets. This ongoing trend has fueled Bitcoin’s momentum, especially as other assets lose ground.

Japanese firm Metaplanet recently raised $25 Million via bond sales to increase its Bitcoin exposure. The company plans to accumulate 100,000 BTC before the end of 2025. The increase in corporate crypto reserves is the reason behind this strategic move by companies.

At the same time, Bitcoin benefits from reduced interest in traditional investment vehicles. Several entities have exited U.S. Treasuries and redirected funds toward Bitcoin. The shift makes the market more aware of this asset, which solidifies its top position in digital assets.

Whales Are Buying: Is A Dogecoin Short Squeeze About To Begin?

0

Key Insights:

  • Dogecoin remains steady at $0.18 while market signals point to a possible major breakout.
  • Technical charts show an inverse head and shoulders pattern, suggesting a bullish reversal.
  • DOGE has moved above the 50-period moving average, indicating growing support at current levels.

Dogecoin (DOGE) price has remained rangebound at nearly $0.18, but recent market activity signals a potential major price breakout.

Accumulation by large holders and technical indicators suggest a bullish shift is brewing. A short squeeze scenario could unfold if key resistance levels break soon.

Dogecoin Shows Bullish Patterns Amid Whale Accumulation

Dogecoin’s price continues to consolidate at $0.18, forming a base that could support a sharp upward movement.

Technical indicators show that during its steady trading pattern, a strong pattern formation developed in the previous several months.

The 8-hour time frame shows an upside-down head-and-shoulders formation, predicting an upward price movement.

A standard technical signal developed when the price reached $0.1305 and its shoulders raised diagonally upward, thus shaping an ideal pattern for eventual upward movement.

The price has successfully surpassed its 50-period moving average, which strengthens support for its present position. The price level combination enhances the possibility that traders will reach the $0.2087 zone.

A price exceeding $0.2087 could lead to $0.2420 as the March 2 peak. The upcoming resistance area will be the $0.2087 area as the next obstacle before reaching greater targets.

The price momentum will grow stronger when trading volumes rise during an upward breakout at $0.21.

Analyst Predicts Dogecoin Surge to $1.1

A market analyst has identified a megaphone pattern on the weekly Dogecoin chart since October 2023.

Regular decreases in highs within this pattern lead to higher resistance boundaries that signal high market volatility and possible price breakouts. A significant resistance level exists near $0.50, which defines the top part of this chart structure.

dogecoin price
Source: X

Since the beginning of 2022, the price has followed a consolidation stage accompanied by renewed purchasing momentum.

The initial price surge for Dogecoin was initiated in October 2022 and reached its apex during April 2024 with an increase of 290%.

The second price increase was initiated in September 2024 before reaching its peak point in December of the same year.

According to the same analysis, DOGE will likely escalate to $1.1 after September 2025. The predicted long-term target for this analysis relies on the megaphone pattern achieving an upward resolution with strong momentum properties.

The mental target of $1 functions simultaneously as a historical landmark and a previous challenge area.

Whale Buying Activity Strengthens Bullish Sentiment

Large-scale holders have continued accumulating Dogecoin over the past two months, fueling speculation of an upcoming breakout.

On May 1, blockchain data revealed a purchase of 100 million DOGE within seven days. At current levels, that amount equals over $18 million.

Since March 7, whale investors have demonstrated substantial growth in their Dogecoin holdings, which started this wider purchase pattern.

Wallets holding between 1 million and 10 million DOGE rose from 10.3 billion to 10.59 billion, marking an addition of 290 million DOGE in less than two months.

Large marketplace stakeholders show their market confidence through their holding decisions of coins in long-term investments.

Market movements with strong effects tend to happen after this behavior, particularly during retail demand growth.

The continuous accumulation of DOGE could reduce total supply levels, directly leading to a short squeeze effect.

Exchange Netflows Suggest Holders Are Taking DOGE Off Platforms

CoinGlass data indicates continuous exchange outflows surpassing inflows since the beginning of November 2024.

External wallet transfers from exchanges imply that traders move cryptocurrency into secure wallets for long-term storage. According to this recent trend, the market-wide selling pressure is shrinking.

Before November 2024, DOGE experienced balanced netflows with low fluctuations between exchange inflows and outflows.

During the initial part of November, exchange activity demonstrated substantial growth, reaching $200 Million in total inflows.

Exchanges faced heavy selling activity, creating this dramatic influx of cryptocurrencies in early November 2024.

DOGE Spot Inflow/Outflow
DOGE Spot Inflow/Outflow | Source: CoinGlass

The market has experienced negative netflows since the $200 million peak because it has shown over $50 million daily outflows from April 2025 onward. Exchanges experience constrained supply during this time period because market participants react to this situation by preparing for upcoming substantial price adjustments. The diminished supply of DOGE tokens on exchange markets may lead to a price increase whenever demand temporarily increases.

Short sellers could face liquidation if DOGE breaks past $0.2087 and holds above $0.21. The spike in rapid price movement would start when short sellers rush to cover their positions while the price advances toward $0.2420, potentially exceeding it. When this situation occurs, momentum tends to quicken its pace within several days.