
Key Insights:
- Dogecoin broke key resistance with an 8% daily surge above $0.17
- Charts showed a breakout target of $0.195 if $0.17 holds support.
- Netflows suggest ongoing accumulation as investors hold through the rally.
Dogecoin (DOGE) broke out of multiple ascending triangle patterns, signaling strong bullish momentum. Its price surged by 8% in a day, surpassing the $0.17 mark.
Traders monitored whether DOGE could sustain its level or face a correction. Rising volume and bullish signals added to the uncertainty in the market.
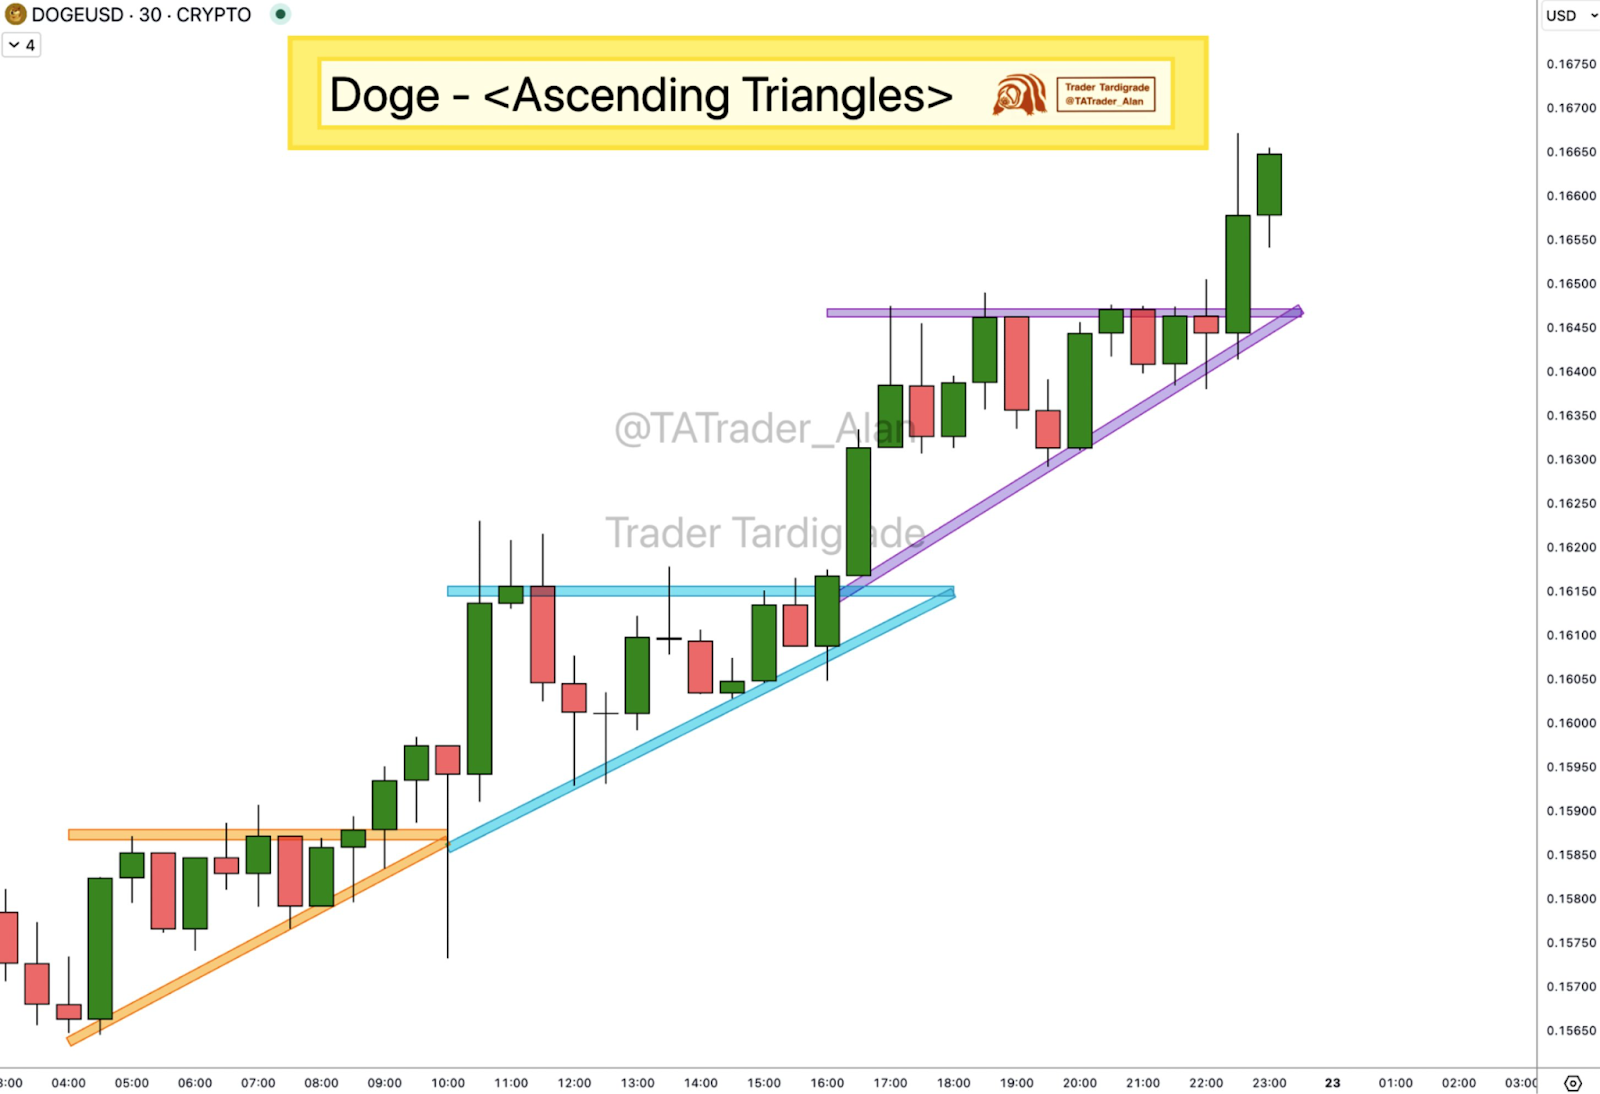
Breakout from Ascending Triangle Pushes Dogecoin Price Higher
Recently, Dogecoin has formed a sequence of ascending triangle patterns, often used in upward price continuation.
Charts from TATrader_Alan confirmed three breakouts across smaller time frames, highlighting strong upward pressure. DOGE’s latest surge pushed its price from $0.164 to over $0.172.
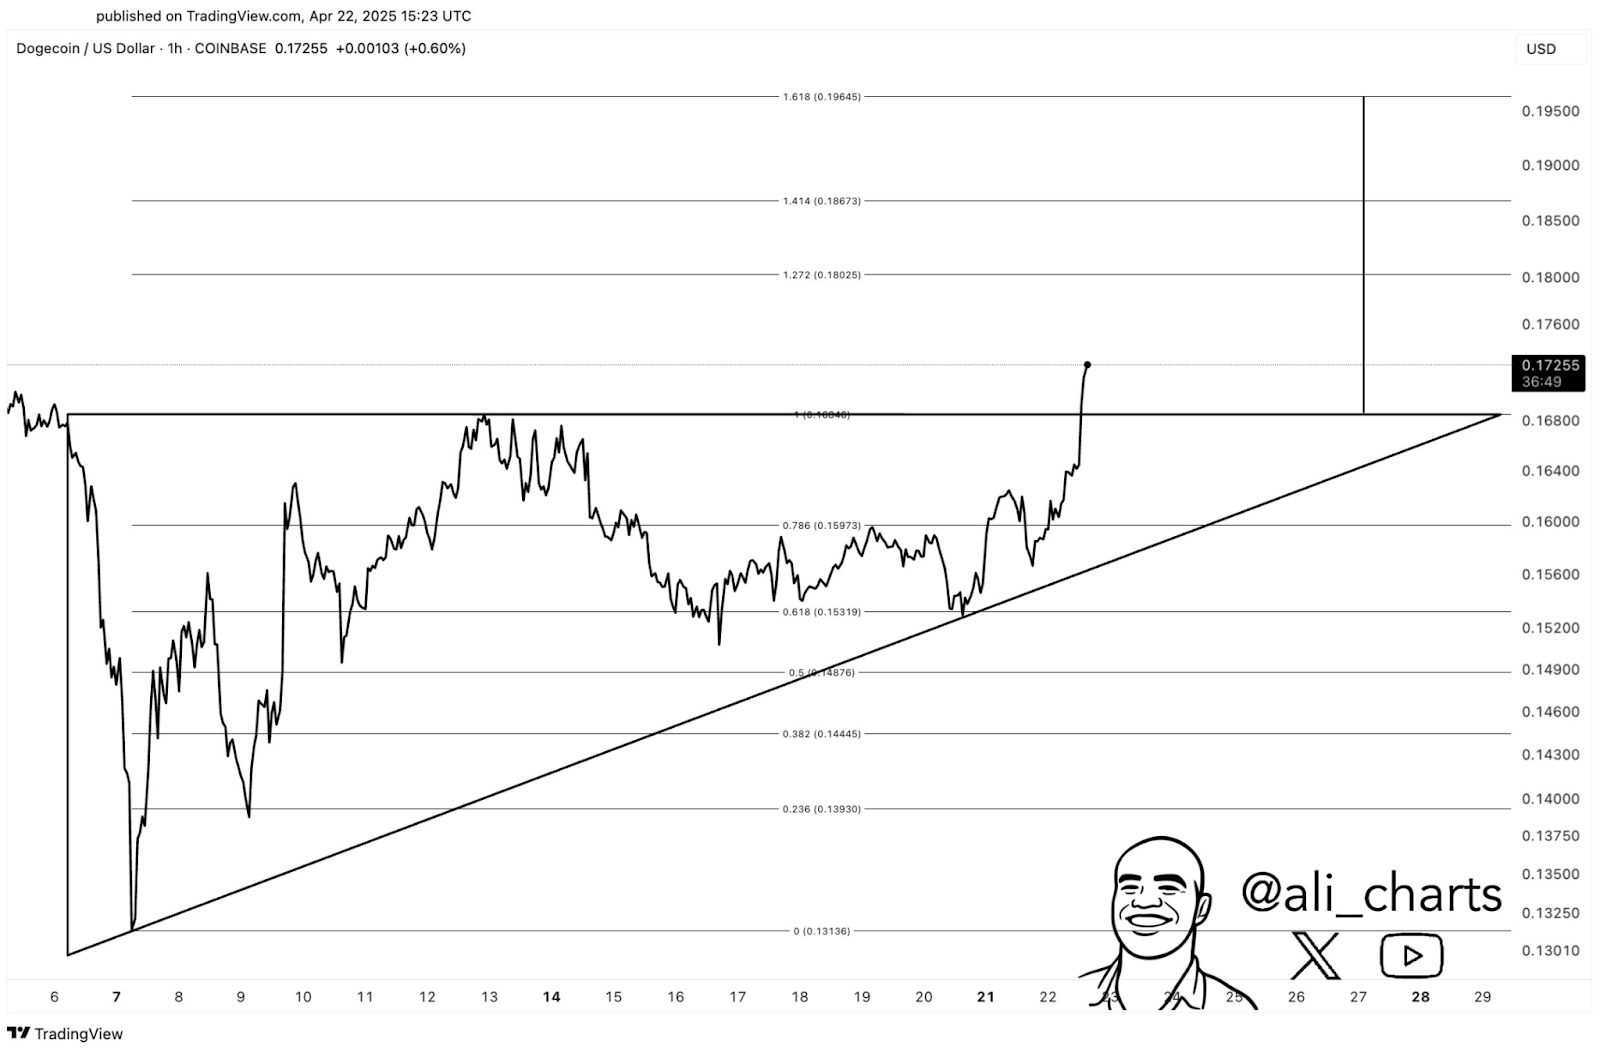
Moreover, Ali_charts also has another chart showing DOGE breaking out of a larger ascending triangle. With the pattern’s structure and Fibonacci levels, a potential upside target is $0.195.
At press time, Dogecoin was trading at $0.1713 with a 24-hour gain of 8.15 percent and a daily volume of $1.26 billion.
DOGE has also entered the top 10 cryptocurrencies by market cap, now at 8, with a market cap of $25.52 billion. The ranking shift and the breakout indicate that the asset is gaining traction and activity.
$0.17 Emerges as Key Level for Dogecoin Price to Hold
The breakout is promising, but analysts stress that Dogecoin must recover and hold $0.17 as support. Ali_charts says that failure to stay above this zone could lead to a deeper correction. Long-term Fibonacci retracement levels place the next lower support around $0.06.
The weekly chart shows DOGE is nearing the 0.786 Fibonacci level at $0.167, which must turn into support. Traders may gain more confidence if DOGE closes above this on higher time frames.
However, bullish momentum could fizzle out if the price is rejected from current levels and closes below $0.17.
Exchange Netflows Suggest Accumulation Continues
In the past few weeks, DOGE’s netflows have been primarily negative, with outflows exceeding inflows. Generally, negative netflows imply that more coins are exiting exchanges than entering. This may indicate accumulation.
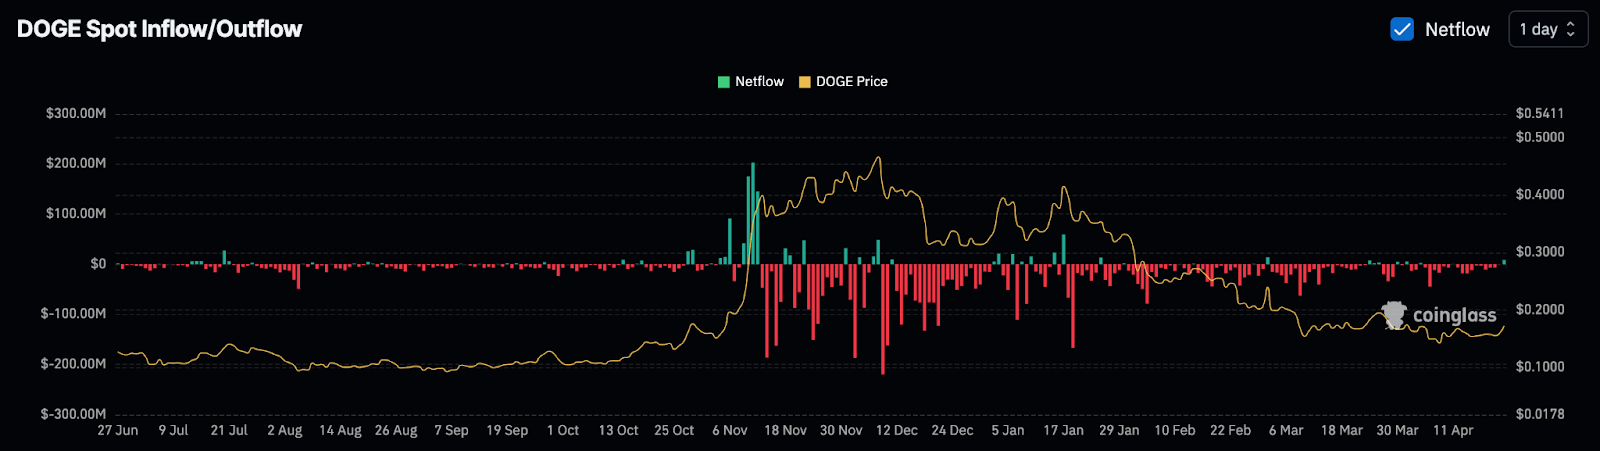
Spot outflows stayed steady in early April as the Dogecoin price fell toward $0.15. The recent price breakout had no sudden spike in deposits, as netflows remained flat as the breakout began. That could mean investors aren’t yet running to sell into the move.
Patterns were similar before significant upward moves in the historical netflows in late 2023 and early 2024. While netflows alone don’t predict price direction, they do help to add context to the broader market behaviour.
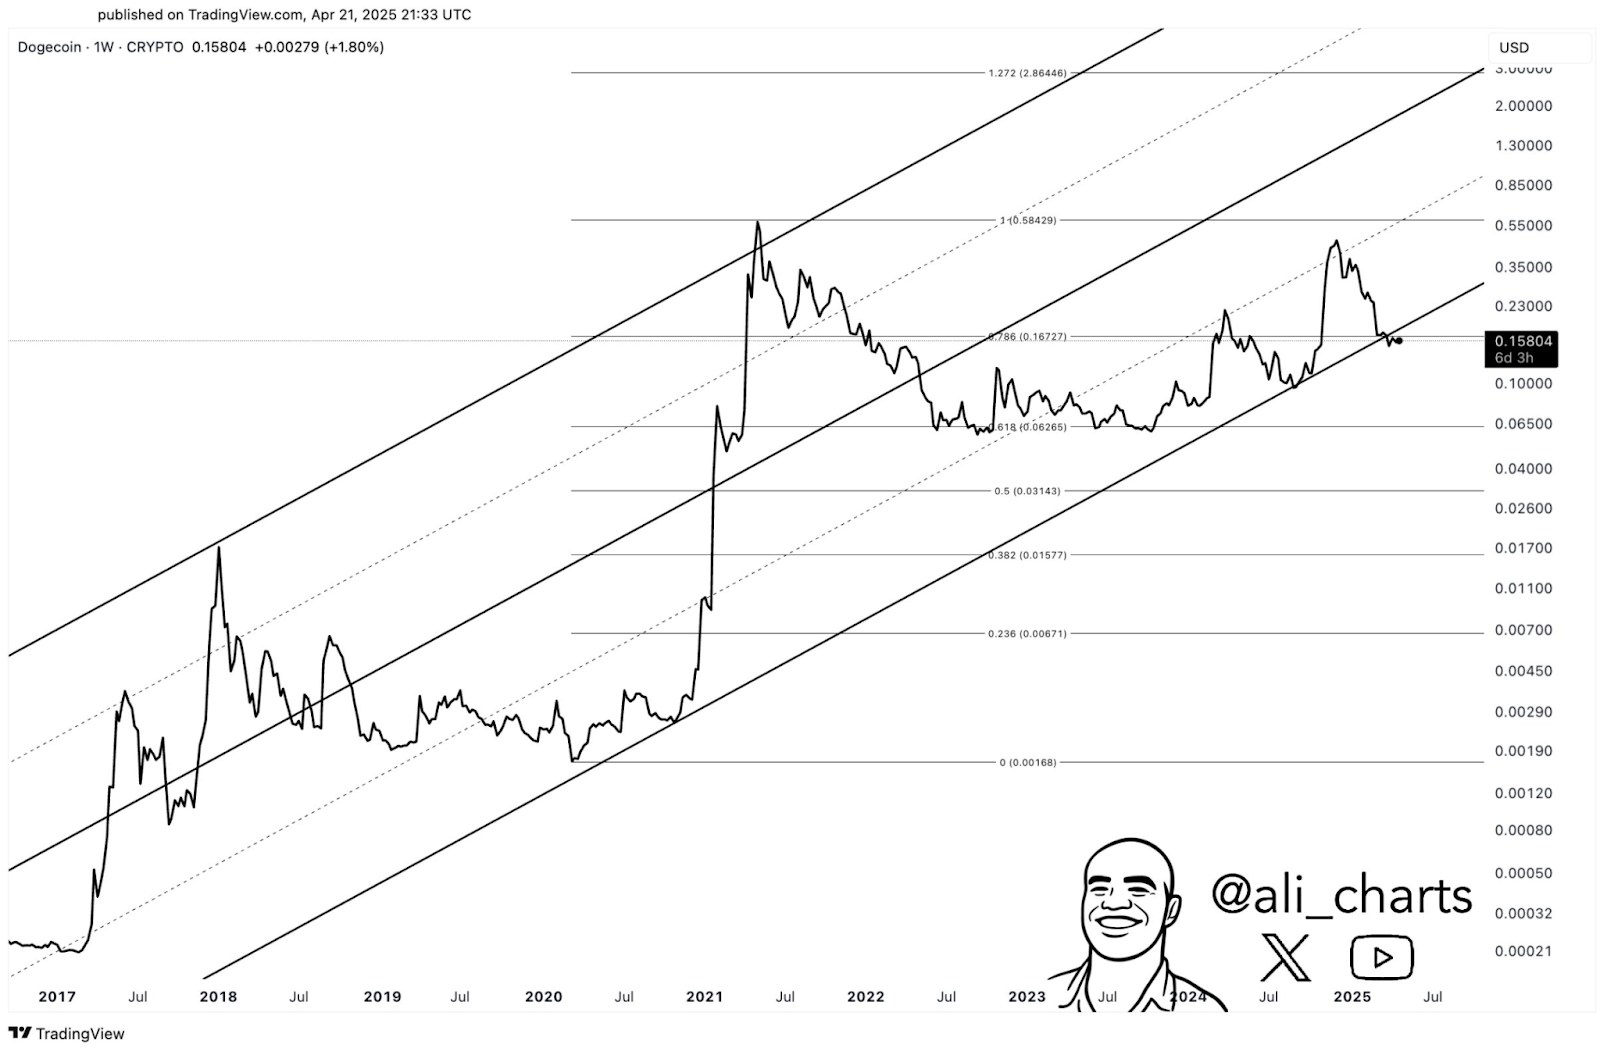
Long-Term Channel Holds as Structure Remains Intact
Ali_charts shows Dogecoin has been rising in a channel since 2019 in a multi-year trend analysis. Previously, DOGE peaked at $0.58 before retracing and consolidating above the 0.618 Fibonacci level at $0.062.
DOGE has been respecting the channel’s midline and bouncing from around $0.14 to current levels. The upper band of the channel could be a long-term target if the trend continues. However, current resistance is around $0.195 to $0.20 using chart projections.
The trend structure remains valid as long as DOGE continues to make higher lows inside the rising channel. However, a failure to hold $0.17 could break the short-term bullish structure and retest previous support zones.