
Key Insights:
- Dogecoin has ended a 159-day downtrend, matching past pre-rally patterns.
- RSI crosses 50, signaling a momentum shift toward a potential bullish phase.
- Spot inflows and outflows stabilize, indicating reduced market volatility.
After a 159-day downtrend, Dogecoin’s price structure is breaking out. RSI has crossed above 50, and a triangle squeeze pattern has formed.
Traders are now looking for a possible 93-day rally to start as inflow and outflow activity stabilizes.
Dogecoin Trends Show Symmetry in Repeating Price Cycles
Trader Tardigrade shows that Dogecoin may be completing a repeating cycle on a long-term chart.
The chart shows two previous 159-day price declines, followed by 93-day sharp rallies.
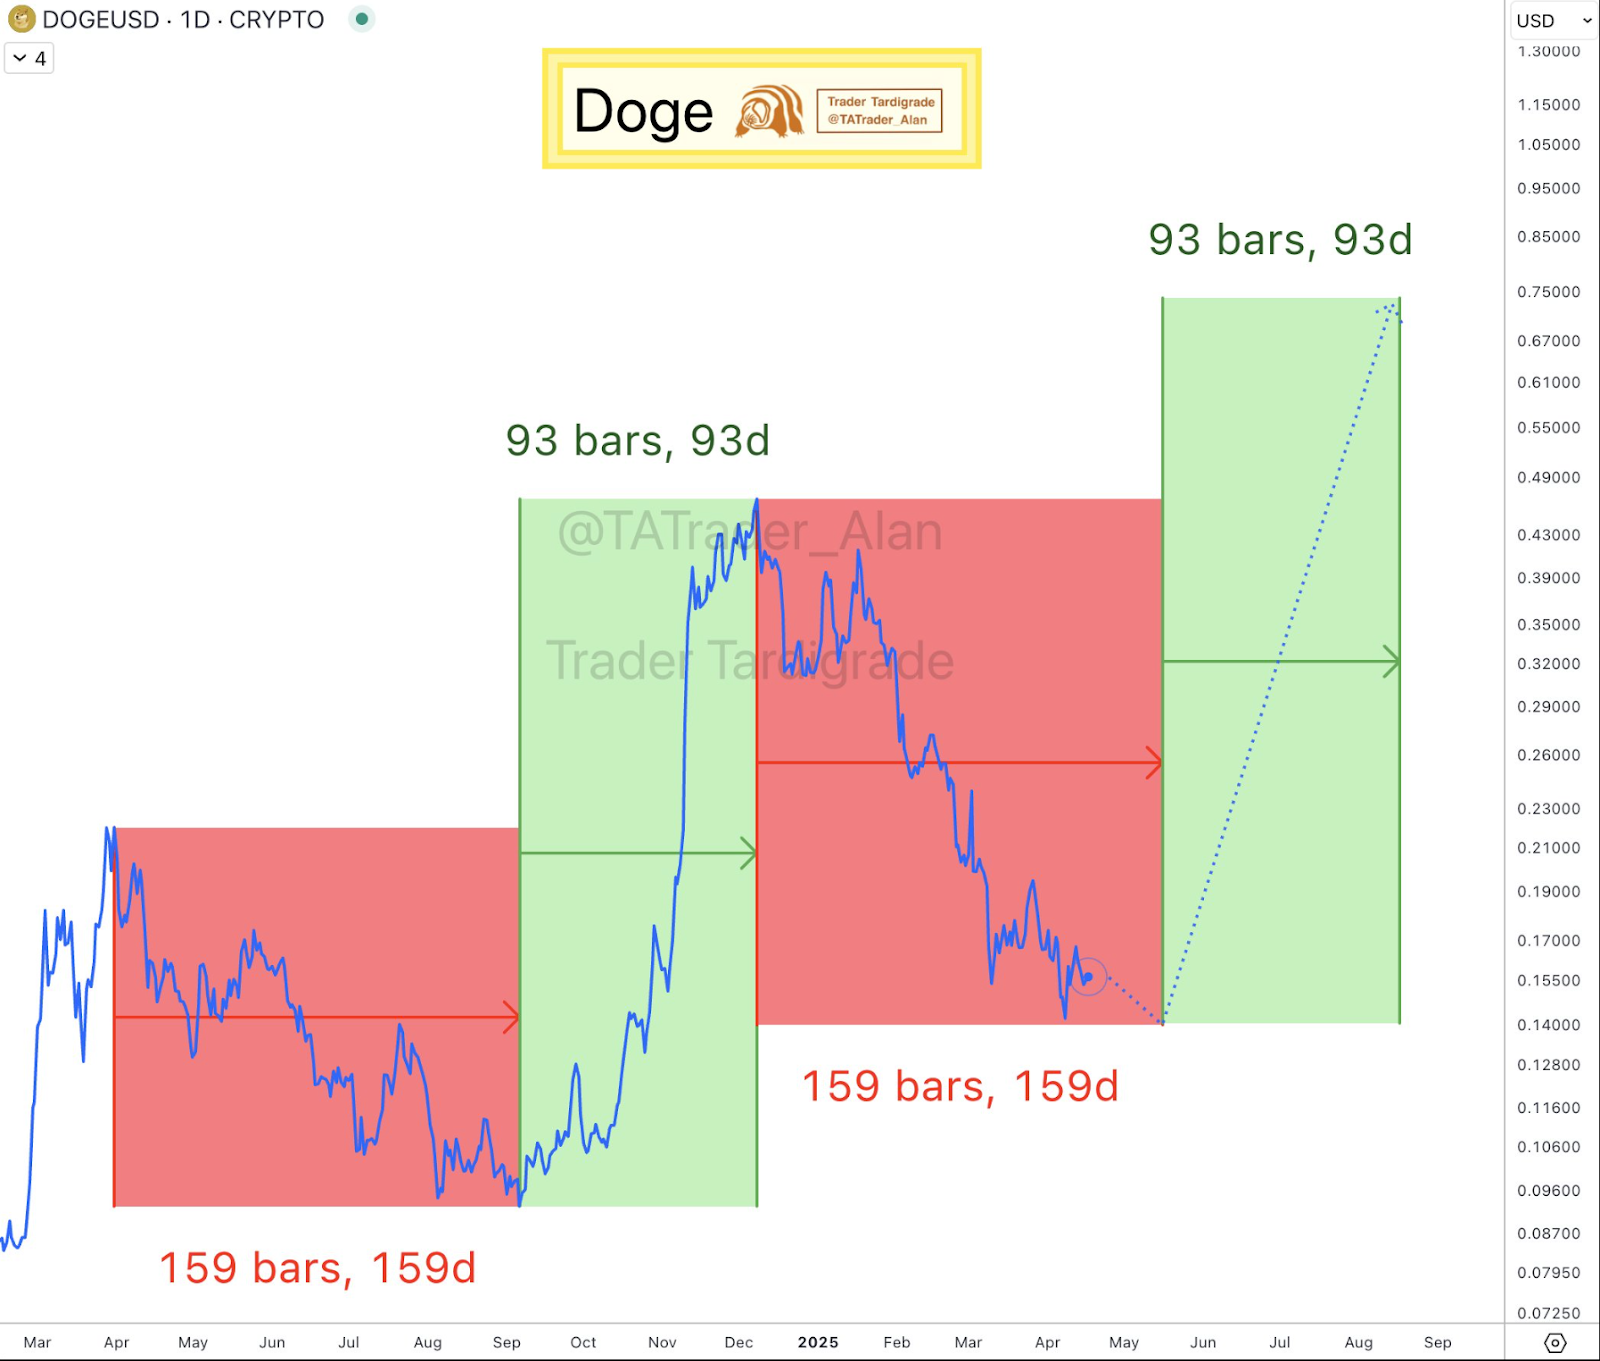
Dogecoin in the earlier example from 2024 fell steadily for 159 days and then rallied for 93 days. During that rally, the price rose from around $0.09 to over $0.43.
A possible move higher could develop over the next three months if the pattern repeats.
The symmetrical structure doesn’t mean price will move, but it has been true for the past two full cycles. And it may provide a framework to explain how traders respond to this phase.
Triangle Squeeze and RSI Rebound Point to Momentum Shift
Additional technical signals are also seen on shorter-term charts. On the 4-hour chart, Dogecoin has printed a triangle squeeze pattern.
This happens when price volatility decreases and the difference between highs and lows shrinks. Usually, these setups show up before a price breakout in either direction.
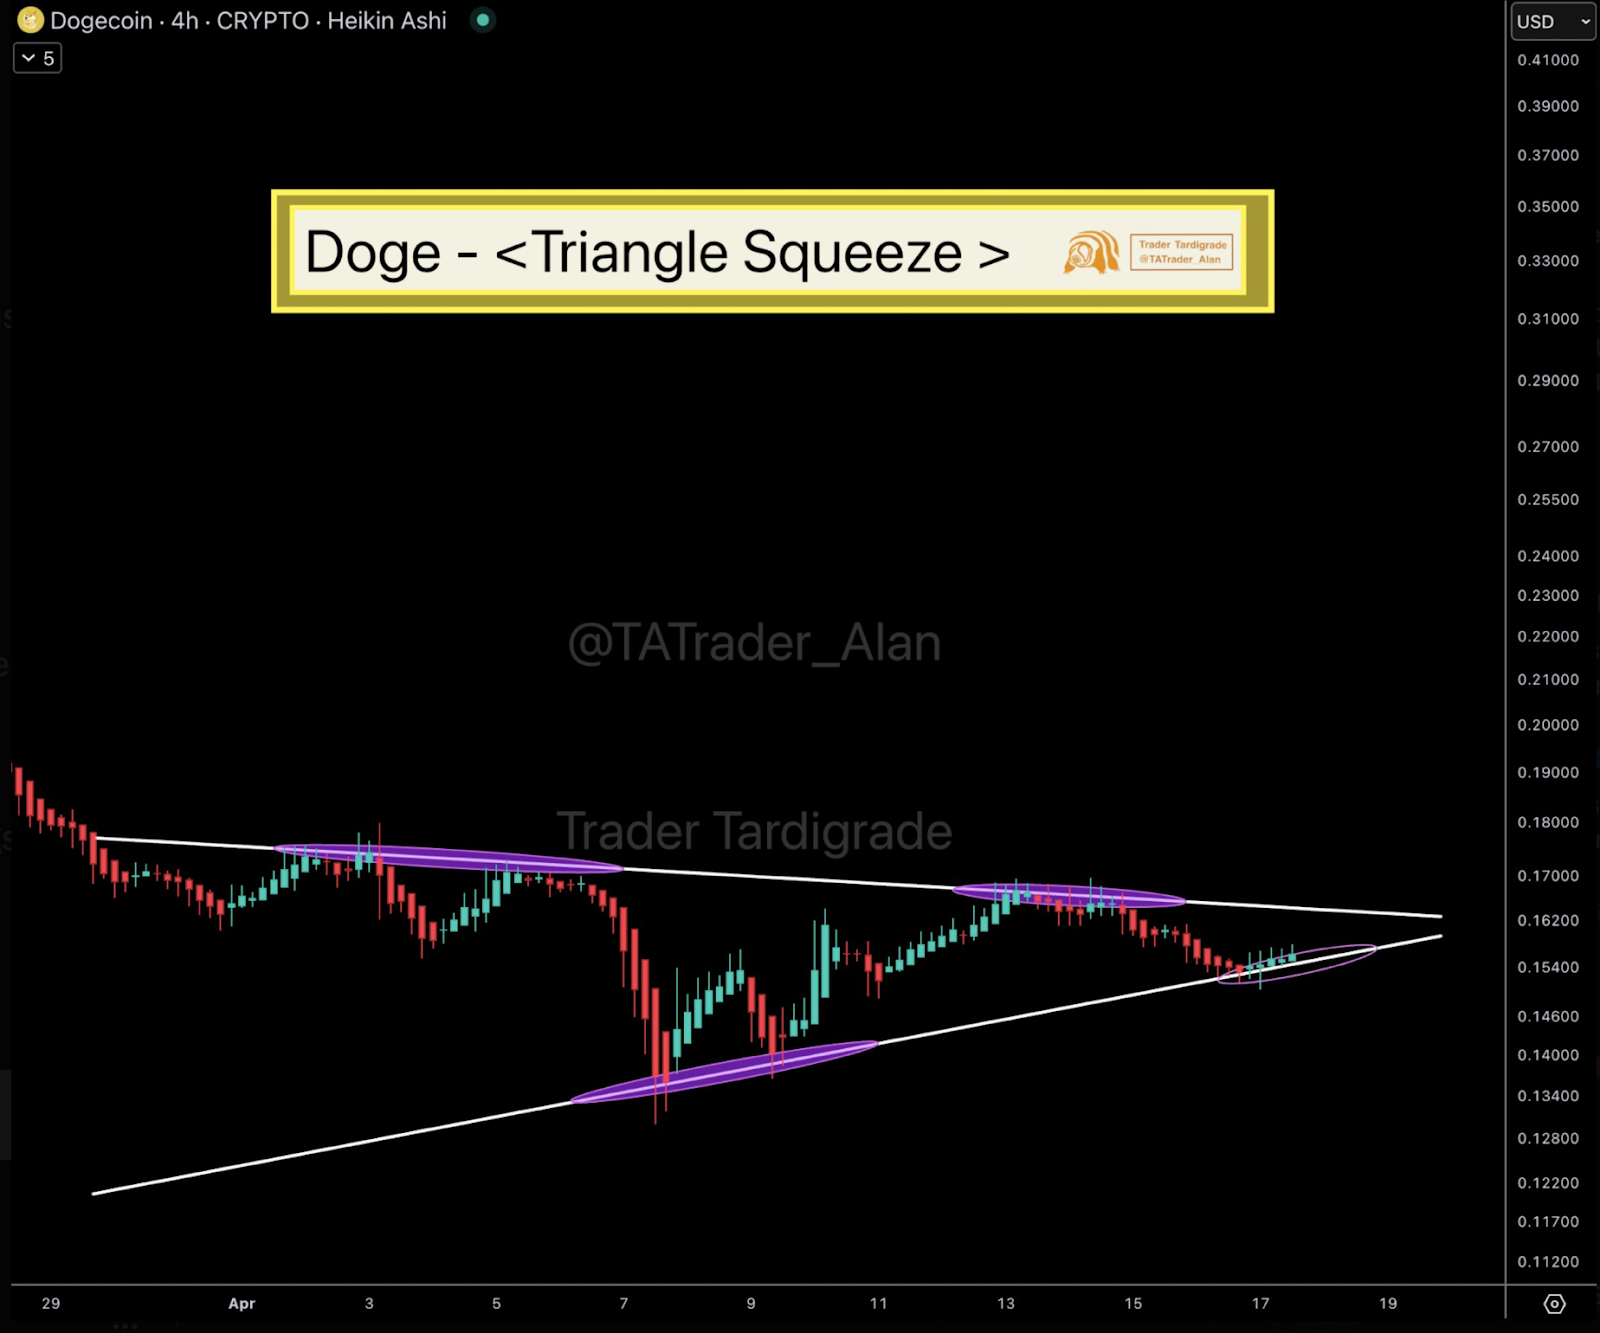
Since the beginning of April, the pattern has held, and the candles of recent days show increasing price action around the $0.154 level.
The upper trendline has held steady, while the lower trendline continues to push higher. This may cause a breakout in the near term.
Moreover, another chart of Dogecoin reveals that it just broke out of a descending trendline.
However, at the same time, the Relative Strength Index (RSI), a key momentum indicator, had crossed above 50.
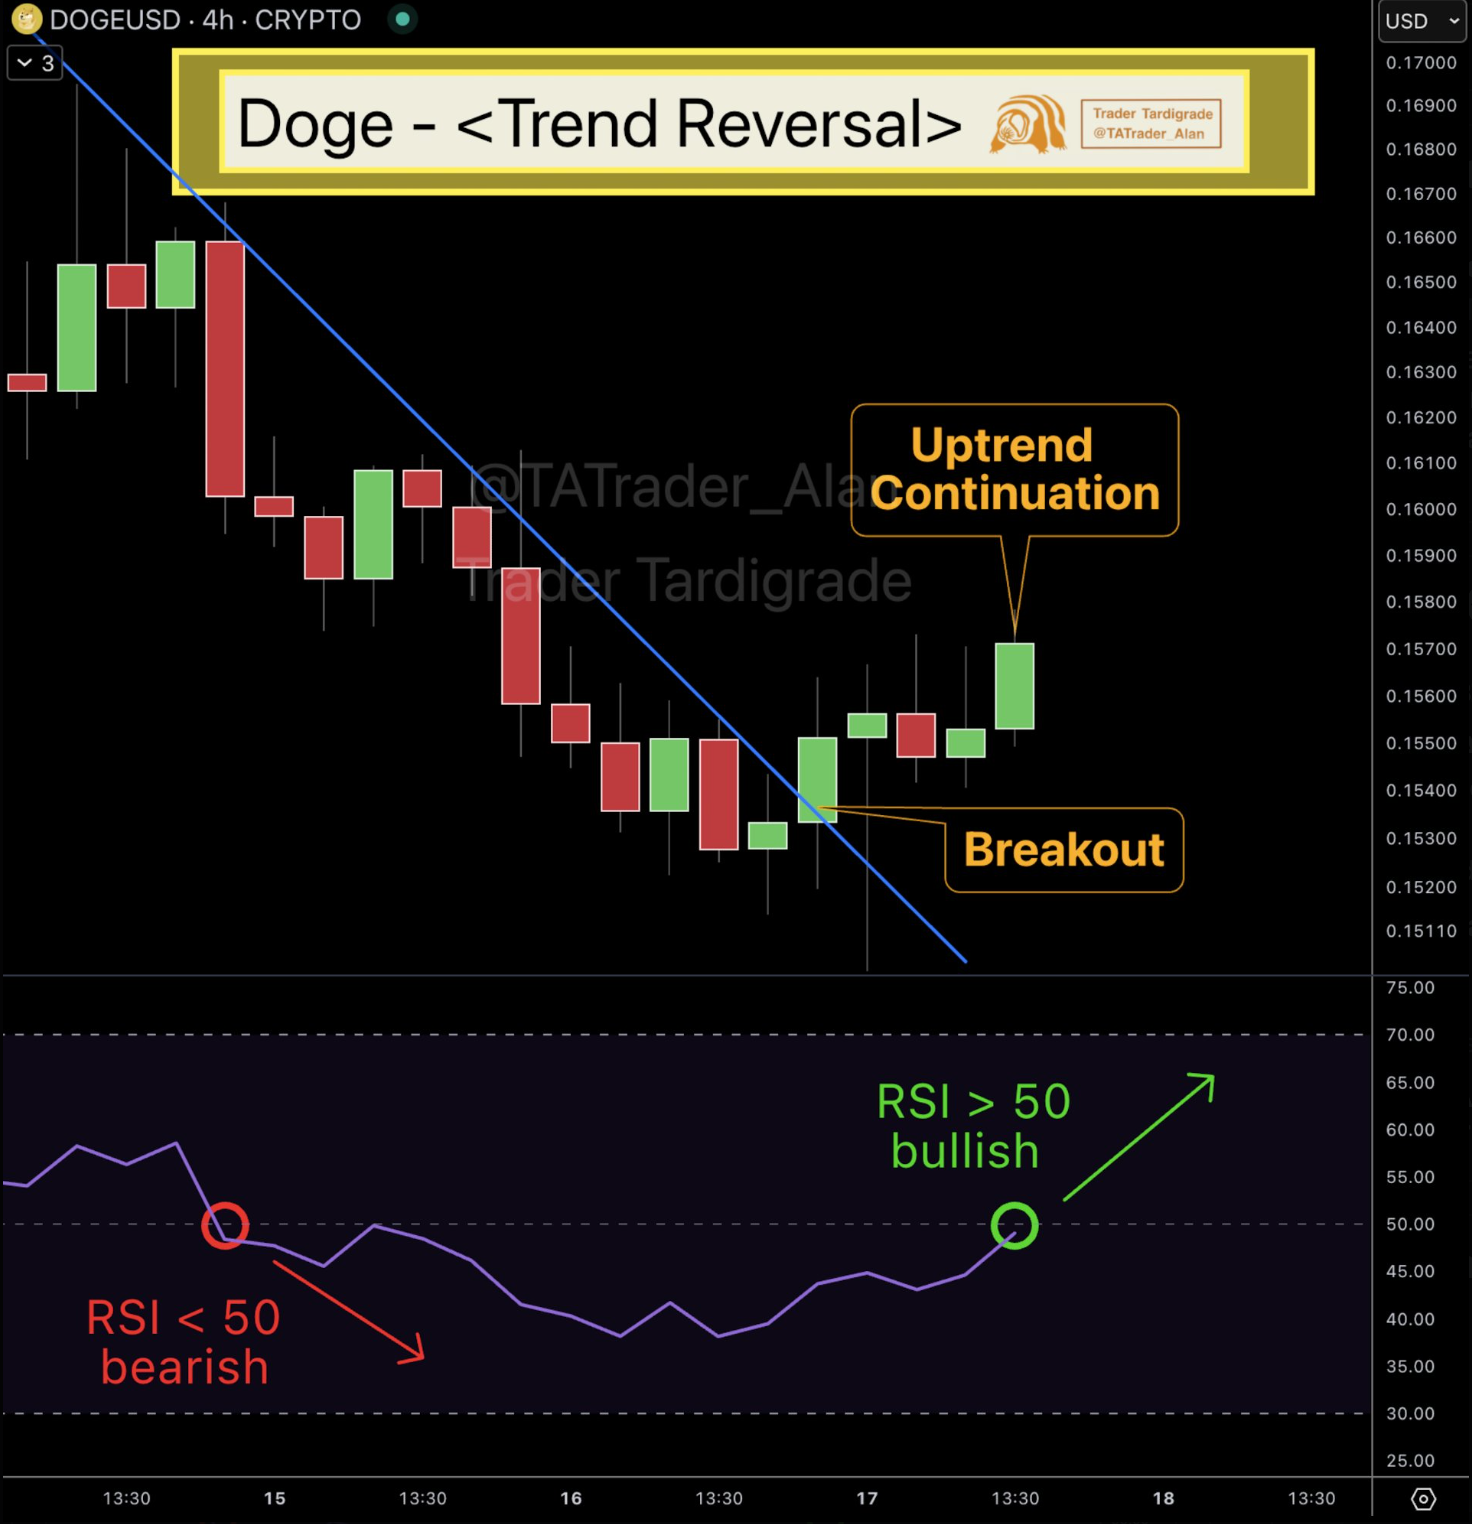
Traders sometimes take an RSI crossing from below 50 to above 50 as a signal that bullish momentum is starting. Dogecoin rebounded from its short-term low at $0.150, and this crossover took place.
Spot Inflows and Outflows Reflect Caution but Stabilization
Dogecoin’s spot inflow and outflow trends since June 2023 are shown in the following CoinGlass chart.
The strongest outflows were recorded mid-November 2024, with values reaching around $6.5 Billion.
It was also a steep rally, with Dogecoin’s price jumping from around $0.10 to $0.4.
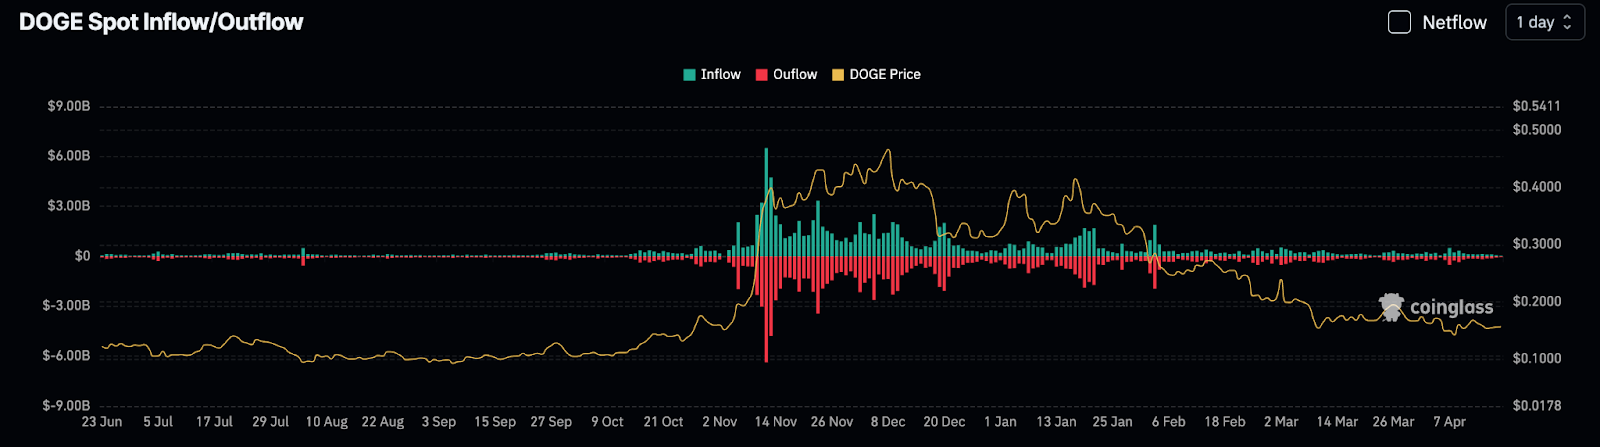
Inflows were consistently rising from November to January, while outflows remained strong. Dogecoin was also at a local peak near $0.390.
But since February 2025, inflows and outflows have been evened out. Now, daily movements are much smaller, usually under $500 Million.
It implies less aggressive buying and selling activity but also indicates a more stable trading environment.
At the same time, the price has been relatively flat, between $0.14 and $0.2.
The signals in the technical charts could be supported or challenged by a sustained change in flow data.
Confirmation of renewed demand may be watched by traders who look for stronger inflows.
Early Uptrend Possibility Market Structure
On the recent 4-hour chart, the price structure has changed from downtrend to uptrend.
The shift became clearer when Dogecoin broke above a descending resistance line and formed higher lows. The move came with stronger volume and a breakout candle.
In past cycles, RSI’s move above 50 has signalled the beginning of bullish phases.
This indicator has often moved early in a trend, and the price has not moved sharply yet.
Traders may consider this a stronger confirmation if RSI continues upward and price follows with higher closes.
Next, we have resistance levels to watch out for around $0.18 and $0.21. These are areas where price previously stopped or reversed.
The support stays around $0.145, which has held on several occasions since early April.
Volatility could still rise, but the signals are now more favourable for a trend continuation after a long downtrend.