
Key Insights:
- BlackRock’s IBIT fund adds 10,220 BTC in a single day.
- Bitcoin ETFs reach highest cumulative inflows since February.
- Macro Chain Index signals Bitcoin’s first long position since 2022.
U.S. spot Bitcoin ETFs saw $591.3 Million in net inflows on Monday, continuing a seven-day streak of positive flows.
The only ETF to see inflows was BlackRock’s iShares Bitcoin Trust (IBIT), which saw $970.9 Million. By April 27, 2025, IBIT’s total Bitcoin holdings reached 575,800 BTC due to this inflow.
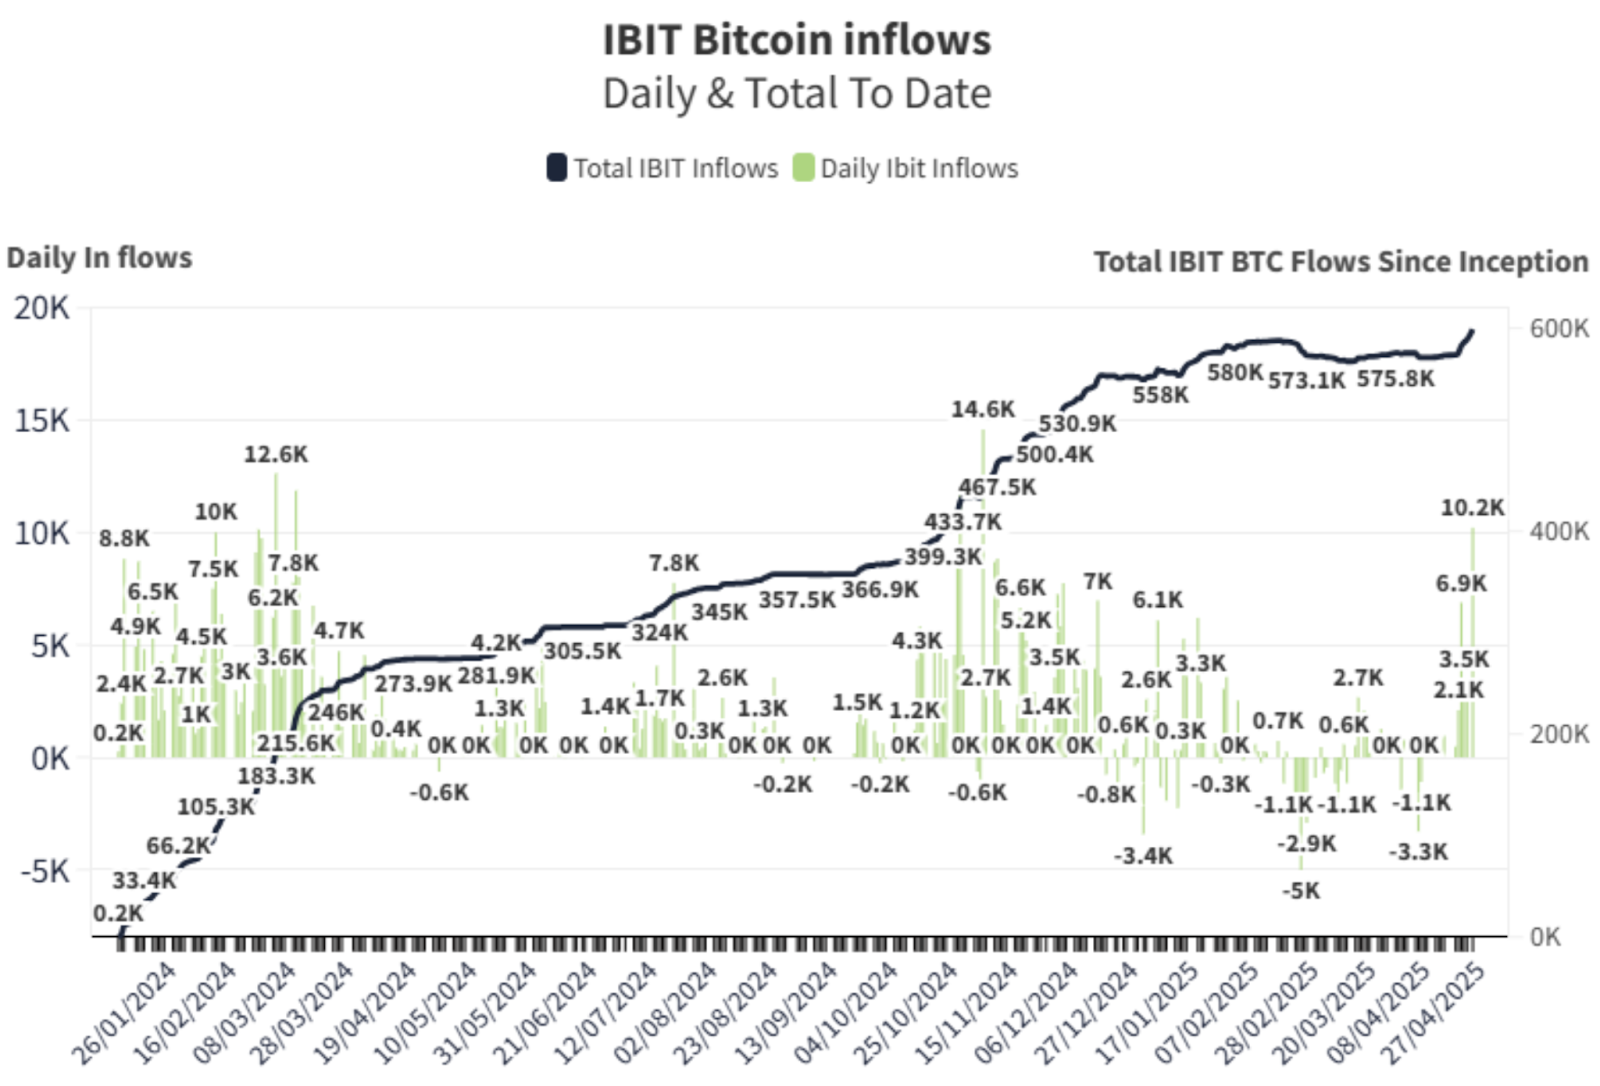
According to IBIT’s chart, 10,220 BTC was added on that day alone, pushing the daily total to the highest level in recent weeks.
Ark Invest’s ARKB and Fidelity’s FBTC also saw outflows of $226.3 Million and $86.9 Million, respectively.
BITB and HODL from Bitwise and VanEck also saw withdrawals, suggesting a mixed investor sentiment across providers.
Bitcoin price did not move much during this time, with a rise of 0.18% over 24 hours to $94,961. In the Asian range, price briefly crossed $95,000.
Ethereum also moved, but it was more subdued, with Ether ETFs taking in $64.1 Million over three consecutive days. Ether’s price also rose to $1,832.
Macro Chain Index Signals a Rare Buy Opportunity
Recently, the Macro Chain Index (MCI) which combines long-term on-chain metrics with price action, gave a long signal.
This is the first such signal since 2022, which was the bottom of Bitcoin’s previous cycle. Momentum is rising as indicated by the MCI and RSI (Relative Strength Index) charts.
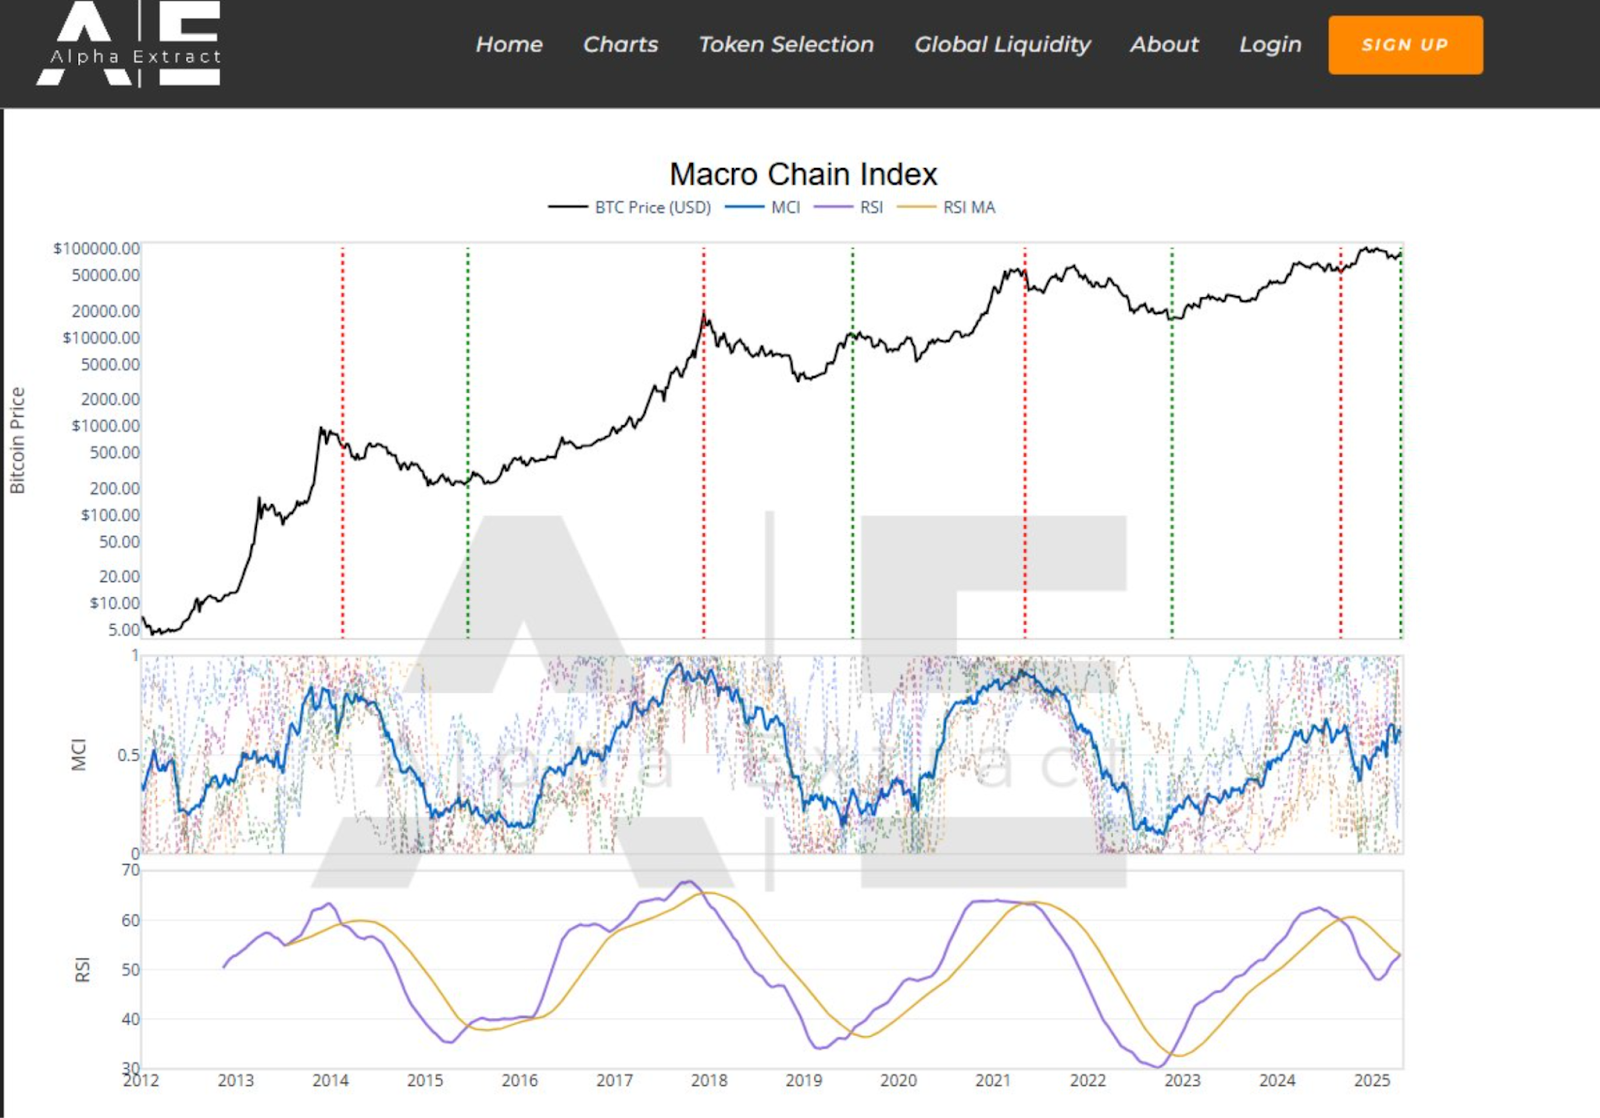
The MCI buy signal has always come just before major price surges. The previous green dotted lines on the chart (past buy signals) correspond to strong upward movements in Bitcoin’s price. On the other hand, red dotted lines marked cycle peaks.
By early 2025, the MCI line is back up, and the RSI curve is crossing above its moving average, which is a sign of increasing strength in the trend.
Bitcoin’s current trading range, just below $95,000, places it near previous resistance levels. If this trend continues, price expansion could come in the next few months.
Furthermore, these movements are in line with the overall market movements. It appears that investors are moving capital to ETFs with better price performance and liquidity.
Together with the MCI signal, the inflow concentration into IBIT implies higher Bitcoin interest to come.
Cup and Handle Pattern Holds Above Retest Zone
Meanwhile, the total crypto market cap forms a clear “cup and handle” pattern in a monthly chart.
It seems the formation is complete with a clean retest of the neckline level around $2.6 Trillion.
While the recent candlesticks show a rebound, the current market cap is at $2.88 Trillion.
This pattern is famous for its bullish continuation tendency if the price retests and bounces above the neckline.
As Titan of Crypto’s chart shows, the market structure is setting up in classic technical setups.
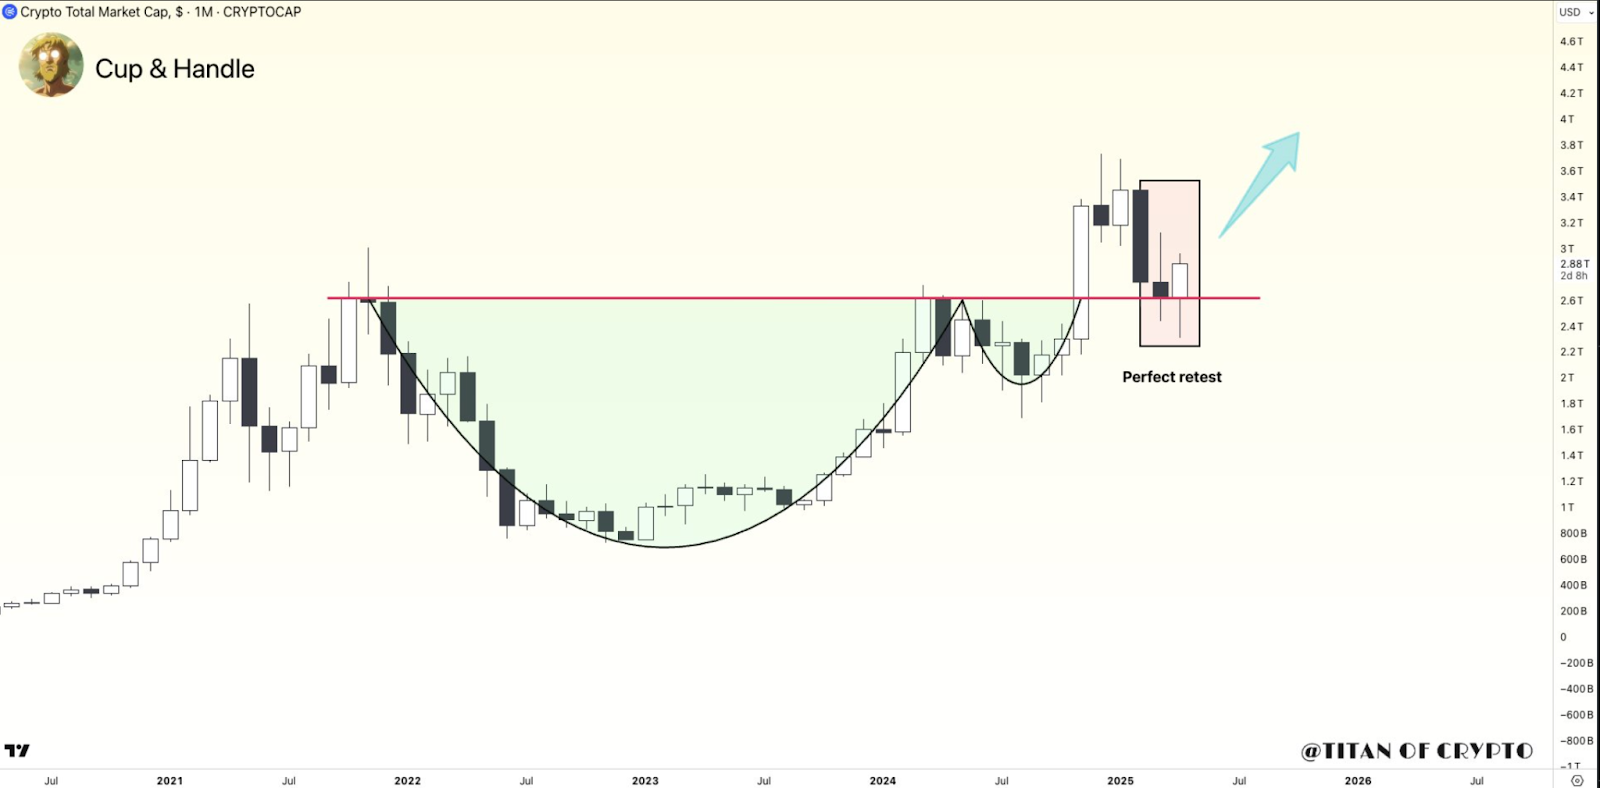
After long periods of consolidation, Bitcoin has a history of moving in large upward waves.
The breakout above the neckline is now sustained, and the previous handle formation ended in a multi-month low.
If market momentum persists and liquidity remains steady, more gains are likely across crypto assets.
As these technical developments take place, Arizona’s move towards adopting Bitcoin at the state level could help legitimize Bitcoin’s role in financial markets if other states follow suit.