
Key Insights:
- Cardano’s price is approaching a possible breakout as it trades within a tightening symmetrical triangle pattern.
- ADA is trading at $0.6424 after gaining 4.3 percent in the last 24 hours.
- Technical analysis suggests a breakout from the triangle pattern could result in a 27% price increase.
Cardano’s (ADA) price shows signs of nearing a significant technical breakout as it hovers within a tightening symmetrical triangle pattern.
With recent upward movement and increased attention from analysts, ADA’s potential for a major move is rising.
Despite current hesitation in market sentiment, technical indicators hint at a turning point that could push ADA upward by 27%.
Symmetrical Triangle Hints ADA Price Surge
Cardano has been consolidating within a symmetrical triangle, which has been forming steadily since the beginning of April 2025.
The price movement will occur soon since market equilibrium is being established. Nonetheless, ADA maintains a trading position of $0.6424, which increased 4.3% throughout the past 24 hours.
Bull and bear traders push prices toward each other as the pattern develops through decreasing price margins.
According to technical analysis by crypto analyst Ali Martinez, symmetrical triangles maintain the existing market trend while forming.
The price could experience sizable gains if it breaks out in the same direction it was previously headed.
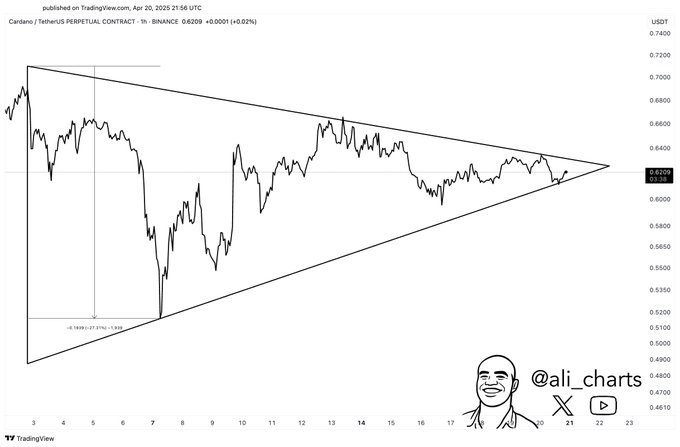
Analyst projections indicate that Cardano might have initiated its breakout phase from this pattern.
Confirming pattern breakout can generate price increases as high as 27% because symmetrical triangles normally display these move patterns.
ADA Holds Steady Amid Mixed Signals
Despite the promising chart pattern, the current sentiment surrounding Cardano remains split.
According to CoinCodex, ADA maintains a neutral sentiment, while the Fear & Greed Index stands at 39, which signals market fear.
The market exhibits caution through inconsistent indicators despite bullish technical trends.
Cardano has recorded 14 green days in the past 30 days, representing a 47% positive day ratio.
ADA remains with a slight upward bias, yet its value decreased by almost 10% throughout the same timeframe.
The 7.31% indicates a moderate yet stable price volatility during the last 30 days.
CoinCodex predicted through statistical modeling that ADA would increase in value to 18.55% by May 21, 2025.
Organizations project ADA’s performance will reach current levels, but the price will not reach its maximum breakout potential.
The projected price movement depends on the market’s performance compared to technical pattern indications.
Cardano Technical Indicators Signal Market Stalemate
The current technical readings suggest high levels of market confusion because clear momentum signals remain absent.
The Relative Strength Index (RSI) measures 45.29 while its moving average is 44.21. At this point, between buying and selling pressure, the market registers neutral indications.
Evaluating the Moving Average Convergence Divergence (MACD) reveals weak momentum development.
The MACD currently sits at -0.0187 below the -0.0235 position of the signal line. Data from the histogram shows 0.0048 as further evidence that a bullish crossover does not currently exist.
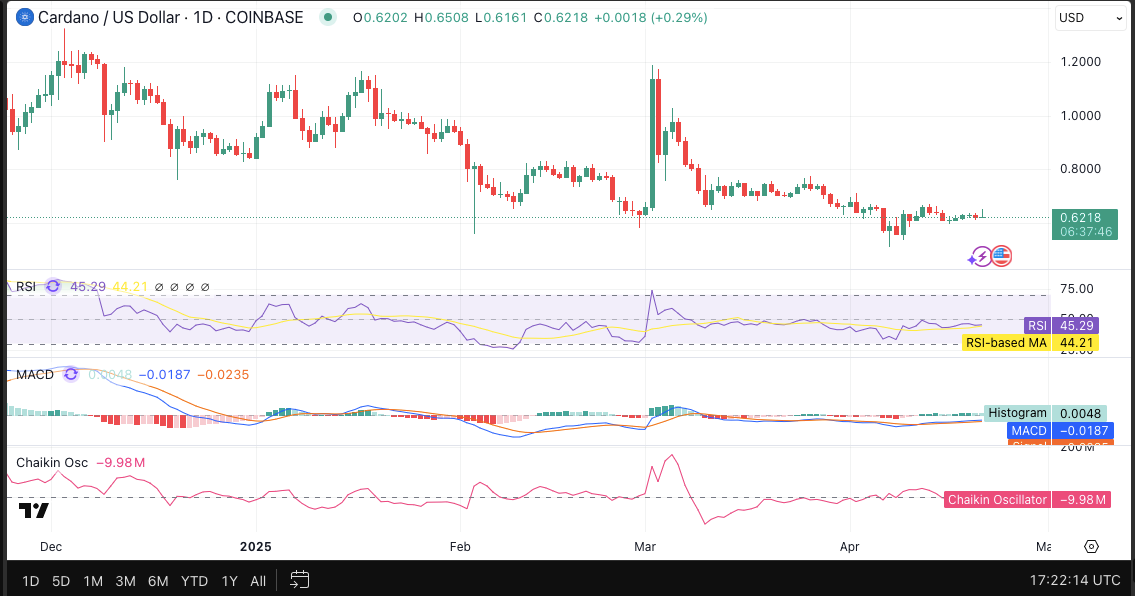
The Chaikin Oscillator is currently in a deep negative position of -9.98 million. The analysis shows continuous distribution activities accompanied by capital movement out of the market.
The ongoing downward trend will probably keep ADA in a trading rut or cause slight market decreases until it reverses direction.
Cardano Funding Rate Flips Show Uncertainty
Derivatives data illuminates existing market situations and reveals sporadic trading actions.
Ada’s funding rate continues to flip between positive and negative values, reflecting divided sentiment among market participants.
The shifting funding rates maintain equilibrium between traders holding positive and negative market expectations.
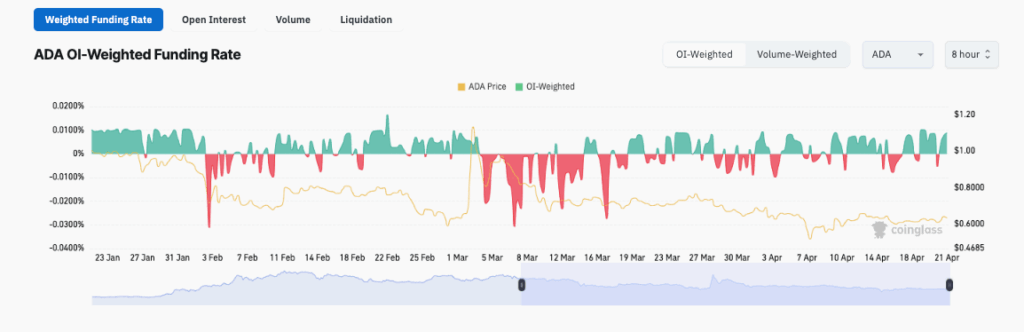
During periods of stable prices, the funding rate exhibits unpredictable behavior.
From early through mid-March, it showed primarily negative values and then transitioned to alternating patterns. This market instability strengthens the derivatives market’s indecision.
The analysis of open interest reveals that market participants maintain no clear direction regarding ADA’s next move.
The ADA price consolidation matches the symmetrical triangular pattern where market traders show equal interest in both direction bets.
Higher momentum and growing volume usually lead to a short-term breakout from the current price range.