Home Blog

Peter Schiff Drops Bombshell: Bitcoin In ‘Major Bear Market’ Now

0

Key Insights:

  • Peter Schiff has stated that Bitcoin is now in a major bear market based on its underperformance against gold.
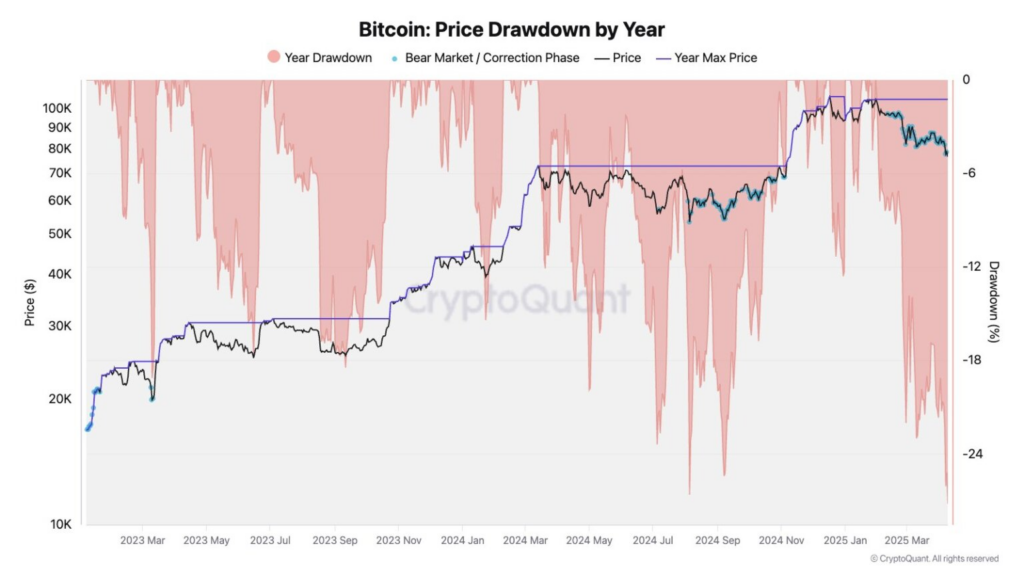
  • Since November 2021, Bitcoin has lost 30 percent of its value when measured in gold despite positive market developments.
  • Schiff argues that Bitcoin does not behave like a store of value but trades like a high-risk speculative asset.

Peter Schiff, a persistent Bitcoin skeptic, has criticized BTC again. He asserted that cryptocurrency is currently experiencing a significant bear market.

Schiff based his remarks on Bitcoin’s sharp underperformance against gold since its all-time high in November 2021. He pointed out that Bitcoin has lost 30% of its value when measured in gold, despite several bullish developments.

While institutional interest and regulatory support have increased, BTC price has failed to show corresponding gains against gold.

Schiff argues that this undermines the “digital gold” narrative promoted by crypto advocates and institutions. His statements come amid visible losses in high-profile Bitcoin acquisitions, including recent purchases by Strategy.

Performance of Bitcoin Against Gold Raises Fresh Doubts

According to Peter Schiff, BTC has experienced continuous price depreciation against gold in the last few years. Since November 2021, Bitcoin has faced notable market losses. This happened despite ETF approvals, and institutions have started to adopt cryptocurrency.

As per Schiff, this financial pattern creates an opposing relationship between the typical Bitcoin and physical gold comparisons.

MSTR
Source: X

Some of Bitcoin’s public support includes claiming that cryptocurrency is an up-to-date way to preserve wealth. According to Schiff, current market data speaks against this assertion.

Bitcoin demonstrates its characteristics as a speculative technology investment rather than a dependable hedge instrument. According to Schiff, Bitcoin price patterns resemble those of speculative, high-risk equity markets.

The expert noted that gold maintains stability during market fluctuations, while Bitcoin suffers considerable price drops. Due to this price movement, Schiff believes the asset classification as low risk faces challenges.

Strategy Faces Losses Amid Aggressive Bitcoin Bets

Strategy, under CEO Michael Saylor, advocates for BTC and has experienced challenges because Bitcoin’s value has decreased.

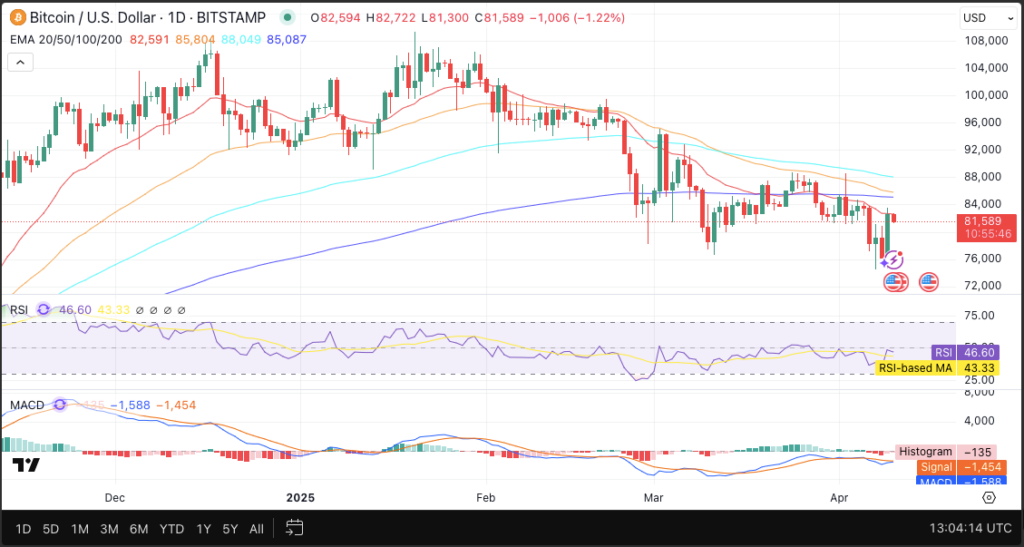
The company purchased its Bitcoin in March 2025, securing 22,048 BTC units at $86,969 each. Since then, the company’s $1.92B Bitcoin investment has decreased by approximately 5.08%, or $97 million.

During February 2025, Strategy suffered especially significant financial losses beyond what they had experienced. Strategy purchased 20,356 bitcoins on February 24 for $97,514 per coin, and they experienced a decrease of 15.44%.

A drop amounting to $307 million exceeds the current worth of Bitcoin acquired in that transaction alone. BTC purchase made on February 10, totaling 7,633 coins at $97,255, has resulted in a 15.01% loss.

The price drop resulted in a $111 Million investment loss on this transaction. The company has maintained a small profit on its March 17 acquisition of 130 bitcoins at $67,382.

Peter Schiff Questions Bitcoin’s Safe Haven Role

Peter Schiff argues that BTC fails to meet its branding as “digital gold.” He provides evidence suggesting it does not function effectively as a safe store of value.

He argues that Bitcoin’s performance during the economic downturn reveals its shortcomings. If it were a reliable protective asset, he claims, it would have demonstrated greater resilience. When measured against Bitcoin, gold demonstrates contrasting performance.

bitcoin
Source: X

Schiff condemns investors who maintain a wrong assumption about Bitcoin as a secure investment asset. According to him, BTC functions like a speculative stock rather than a defensive investment. The high level of price volatility impedes its suitability for strategic reserves.

Schiff expressed doubts about why institutions purchase this unstable investment. According to Schiff, the value of strategic reserves should remain consistent while being predictable.

The unpredictable price variations of Bitcoin make him doubt its worth as a strategic reserve, according to his viewpoint.

Schiff Urges Rethink of Bitcoin’s Investment Role

Peter Schiff attacked Bitcoin on two fronts: evaluating its price movements and challenging its classification as an asset. According to his assessment, the lack of income generation and ownership in productive enterprises makes Bitcoin unable to sustain high value.

In his opinion, investors must weigh the justification for maintaining their Bitcoin investments. According to Schiff, Bitcoin attracts purchasers mainly because individuals sense widespread market positivity and readiness to take risks.

Such characteristics make BTC function similarly to momentum-based assets, which diverge from traditional hedging instruments. Schiff presented that Bitcoin does not possess essential qualities that constitute safe-haven assets.

He demanded that institutions show evidence of investment decisions regarding this volatile commodity class. The gold-like properties of Bitcoin fail to match the standards needed to earn its classification as “digital gold.”

Strategy’s Bitcoin Strategy Faces Mounting Pressure

Despite mounting paper losses, Strategy’s continued Bitcoin purchases have triggered growing concerns among investors and analysts. All significant investments acquired by the company since February 2025 have shown negative performance in April 2025.

The substantial amounts of Bitcoin ownership and significant losses led firms to accumulate renewed inquiries. The large purchase of 22,048 BTC at $86,969 on March 31 represents the biggest deal and has depreciated by 5.08%.

February 24’s largest Bitcoin purchase resulted in the firm’s biggest loss. A 15.44% decline affected the 20,356 BTC acquired on that date. These transactions have caused the firm to suffer a paper loss of more than $500 Million.

The price of BTC has decreased during this period. However, positive market developments like ETF approvals and corporate adoption typically support Bitcoin’s market value.

Based on his analysis, Schiff maintains that Bitcoin has lost its institutional support based on the observed decreases in Bitcoin investments. According to Schiff, Bitcoin’s decay has removed its investment potential.

Institutional Optimism Fails to Offset Declining Value

Bitcoin’s recent downturn in a market environment with promising characteristics provoked uncertainty regarding its enduring stability. Bitcoin has struggled to capitalize on positive market conditions.

Despite presidential support for cryptocurrency and innovative financial systems, its performance remains unimpressive. Bitcoin is still under downward market pressure even as Strategy and other businesses expand their leveraged acquisitions.

Peter Schiff uses this mismatch to demonstrate significant shortcomings within the Bitcoin theory. In his opinion, Bitcoin’s decreasing value appeal remains despite its institutional backing.

$456M Diverted? Justin Sun Claims Address Swap In FDT Scandal

0

Key Insights:

  • Justin Sun has accused First Digital Trust of diverting $456M, which was meant for investment in a Cayman Islands fund.
  • Sun claimed the funds were instead sent to a Dubai-based company with a similar name controlled by a related party.
  • He compared the alleged act to a blockchain-style “address replacement” attack used to misdirect digital assets.

Justin Sun has accused Hong Kong-based custodian First Digital Trust (FDT) of orchestrating a $456 Million fund diversion. 

The founder of TRON outlined an alleged scheme involving misdirected investments, secret accounts, and kickbacks. The dispute has escalated into a legal battle, with both sides taking firm positions and filing lawsuits.

Justin Sun Alleges Address Swap Tactic in Fraud

According to Sun, the controversy centers around a transfer meant for a Cayman Islands mutual fund. In his Congressional testimony, Justin Sun stated that funds were transferred to a Cayman Islands mutual fund. 

He revealed that these funds were then redirected to an entity in Dubai with a different name. Blockchain thefts typically result in “address replacement” incidents, as he established during this investigation.

His understanding of the matter came from the similarities between Aria Capital Management Ltd. and Aria Commodities DMCC. The writer determines that unauthorized personnel received funds from a third business owner while under their influence. 

The diversion of funds became possible due to a slight modification between the intended and actual payment recipients. According to Justin Sun, the $456 Million was designated for a Cayman Islands fund Brittain operated. 

Brittain’s wife, Cecilia, was linked to the Dubai entity that received the funds. This differed from the expected recipient, a Cayman Islands fund overseen by Matthew Brittain. He described this deceptive practice as intentionally deceiving stakeholders and avoiding oversight.

Sun describes the fraud as an organized scheme that internal company personnel might have mounted. 

TRON founder maintains that FDT management joined actively in running the transaction procedures. Justin Sun stated that FDT senior executives violated their duty to safeguard client assets.

FDT Leadership Named in Secret Kickback Scheme

Sun exposed others besides Teng for involvement in various scandals during his allegations. Justin Sun identified three individuals involved in the fraudulent scheme: FDT CEO Vincent Chok, Yai Sukonthabhund, and Alex De Lorraine. 

They reportedly received substantial kickback payments as part of the operation. Vincent Chok admitted to overseeing over $15.5 Million in transfers to a concealed account. This acknowledgment came from his statement regarding the operation.

Sun claimed that the Glassdoor account operated by Hong Kong was used to mask income. Aria DMCC was the financial source of the undisclosed funds he alleged were illegally obtained.

The evidence suggests FDT leaders were fully aware of and motivated personally by their alleged fund theft. Sun claimed the leadership intentionally made this transfer to generate profit for a restricted group. 

Justin Sun employed the naming correlation between the entities to demonstrate the existence of deception. These techniques achieve their goal by hiding behind minor variations to deceive people. His belief expressed a resemblance between this method and crypto-related address manipulations.

According to his description, the trusted financial operators took measured risks through this method. Traditional systems have allowed what Sun considers to be digital-style fraudulent execution, according to his belief. According to him, the internal checks failed because employees who operated as insiders chose to ignore them.

Justin Sun Launches $50M TUSD Recovery Plan

First Digital Trust decided to pursue legal proceedings in Hong Kong after public statements of accusation against the company were published. First Digital Trust submitted a defamation lawsuit to the courts, which included a court order request. 

According to FDT, Sun falsified the information, harming the company’s reputation. Both custodians denied any misconduct in their business tasks while insisting on complete business solvency. 

The company defended its financial state by arguing its misrepresentation alongside wrongful accusations against its honorable staff members. FDT asserted its stance using the legal system and stressed the importance of transparency.

The firm’s legal representatives declared that Sun’s public statements caused market confidence to wane. Sun’s posts about FDUSD briefly deviated from its peg, drawing more attention to the situation. The stablecoin reversed its deprecation, and its value reached $0.9987 when the latest updates occurred.

The Recovery plan did not faze Sun as his organization continued its momentum. The money offer amounted to $50 Million to find and restore all missing funds from TUSD reserves. 

According to Justin Sun, the process would stabilize stablecoin trust by promoting transparency and building stability in the token.

Dogecoin Eyes $1 After Rebound—Is A New All-Time High Coming

0

Key Insights:

  • Dogecoin has reversed its multi-month downtrend and reclaimed a key breakdown at $0.153.
  • The recent rebound sparked speculations that DOGE may have reached its bottom before a potential rally.
  • Market analysts believe this price action could begin a sustained upward trend for DOGE price.

Dogecoin has reversed its months-long downtrend. It now shows early signs of a potential recovery. The memecoin reclaimed a critical breakdown level and triggered speculations of a broader price rally. Analysts and market watchers are now weighing the likelihood of a new all-time high before June.

Dogecoin Reclaims a Key Breakdown Level Amid Renewed Bullish Sentiment

Dogecoin price movement has shifted after reclaiming a previous breakdown level at $0.15300. After this development, the price rebound pushed to double-digit morning gains. This recovery has sparked discussions that the DOGE crypto price may have formed a solid bottom.

Market conditions maintained bearish tones starting in January 2025, during which the meme coin experienced three major breakdowns before reclaiming its lost support levels. These new price movements indicate a possible closure of the extended bear market span. Market experts attribute this to the potential ongoing development of a sustainable market trend.

doge price
Source: X

Trader Tardigrade identified the rebound as DOGE’s first significant support reclaim since the start of the year. Since buying demand has started strengthening, Dogecoin prices may rise in future weeks. The recent fast recovery proves that DOGE possesses endurance despite its past repetitive breakdowns.

Analysts Predict Dogecoin Recovery Ahead of ETF Catalysts

Despite current resistance levels, Market analysts are optimistic about DOGE’s short-term outlook. Expert analysts anticipate that Dogecoin can advance further as it approaches fresh record levels. The growing momentum in the market gains additional support from increased discourse about ETF developments.

Master Kenobi expects DOGE to reach a new all-time high by early June, citing strong reversal patterns and support reclaim. This optimism aligns with emerging trends and suggests Dogecoin has already bottomed out. Several analysts agree that DOGE’s downside potential now appears limited.

dogecoin price
Source: X

Fundamental factors are also contributing to this improved outlook. 21Shares has filed for a spot Dogecoin ETF, which triggered increased interest from institutional investors. A previous ETP collaboration between 21Shares and House of Doge supports confidence in future listings.

Technical Indicators Show Mixed Signals Amid Ongoing Bearish Pressure

Despite the recent rebound, DOGE remained under mild bearish pressure based on its technical indicators. When writing, DOGE’s market value was $0.154 after falling by approximately 4 percent during the day. The token rested beneath key Fibonacci levels, where $0.147 was the support level.

DOGE price kept trading within a downward channel that started in mid-December 2024. The token has consistently resisted breaking through its resistance points, and these attempts have never succeeded. Technical indicators showed mixed signals about the recent price improvements, which could not permanently transform the market direction.

doge usd
DOGE/USD 24-hour Price Chart | Source: TradingView

The Relative Strength Index (RSI) was at 41.70, continuing to stay below the central value of 50. Current evidence showed diminishing demand, although price recovery happens occasionally. The Aroon indicator displayed an Aroon Down value of 78.57% together with an Aroon Up value of 0%, which indicates dominant bearish momentum.

Futures Market Sentiment Reflects Caution Among Derivatives Traders

Market participants who trade derivatives continue to approach their positions with caution based on funding rates and Open Interest (OI) data. Recent weeks have introduced negative and positive trends to funding rates after their positive stance during late 2024. 

The market signals higher uncertainties through shifting value indicators. That indicates decreased buy-side interest in prolonged investments.

doge price
DOGE OI Source: Coinglass

The funding rates experienced negative moments in February and March, demonstrating bearish market sentiment during major selling periods. The observed neutral funding rates might suggest lower market turbulence and weak interest in purchasing. The recent market rally has thus far failed to impact the general perception of investors toward futures.

Open Interest shows little change because traders prefer waiting for concrete signals to start new position setups. Trader participation levels have remained flat, which is additional evidence supporting traders’ remaining in a conservative state. Market players choose to remain inactive until the market produces more conclusive signals.

As Dogecoin eyes the $1 mark, market momentum needs to build further for the price to break above resistance. The token must successfully navigate important areas and keep up the momentum to prove its worth to a broad audience. The first move is to recover from previous breakdown positions; however, additional verification remains essential.

Coinbase CLO Slams FDIC as Delay Tactics Stall FOIA Lawsuit

0

Key Insights :

  • Coinbase is in a legal battle with the FDIC over delayed responses to a FOIA request.
  • The FDIC requested 16 more days to respond despite missing multiple court-imposed deadlines.
  • Coinbase filed the FOIA request through History Associates to obtain records on FDIC actions against crypto banking.

The legal dispute between Coinbase and the FDIC has escalated further. The intensification followed delays in the agency’s response to a FOIA request.

The exchange accused the federal regulator of using stalling tactics after failing to meet multiple court-ordered deadlines. This growing dispute underscored mounting tensions over transparency between crypto firms and U.S. regulatory agencies.

Coinbase CLO Criticizes FDIC Secrecy

Judicial authorities granted the FDIC an extension of sixteen days to respond to Coinbase’s FOIA petition. This decision comes from the U.S. District Court for the District of Columbia.

The agency defied court-set deadlines, which raised skepticism among Coinbase’s legal advisers and company staff. The core aspect of the lawsuit consists of claims about the FDIC using actions to exclude crypto companies from banking solutions.

FDICgov
Source: X

Coinbase, via History Associates, submitted a FOIA request for records detailing FDIC efforts to hinder crypto banking services. This move reflected its intent to uncover regulatory actions affecting the crypto industry.

The firm maintained that the regulator prevents legitimate FOIA-based data acquisition efforts directed at receiving essential information. Despite a previous legal mandate, the Federal Deposit Insurance Corporation persists in withholding essential documents, according to Coinbase.

In Coinbase CLO Paul Grewal’s assessment, the suspicious pattern represents a calculated effort to prevent transparency regarding important information. The available documents the FDIC shared were marked as private, so the content value was minimal, according to him. 

Grewal’s statement showed increased discontent regarding the FDIC’s refusal to take the FOIA requirements seriously.

Coinbase Criticizes Heavily Redacted Disclosures

The documents the FDIC released were so redacted that Coinbase could not derive any substantial insight from them. As per a statement by Grewal and co-counsel Jonathan C. Bond, these redacted documents violate fundamental FOIA purposes. 

The FDIC encountered accusations of avoiding transparency despite receiving court instructions to cooperate. The agency’s conduct against Coinbase violates Freedom of Information Act requirements by obstructing timely and meaningful public records disclosure processes. 

According to the company, fair regulatory norms are disrupted by the FDIC’s actions. Federal transparency laws require the firm to deny all attempts at resistance.

Coinbase formally objected to the FDIC in March 2025 over its opaque redacting practices. This displayed nonconformity with the court-established conditions. The released material proved inefficient because censorship measures eliminated almost every piece of information.

Coinbase maintains that the FDIC’s lack of transparency obstructs a fair review of its role in restricting banking services for crypto companies. This stance emphasizes concerns over regulatory clarity in the crypto sector.

Operation Choke Point 2.0 Sparks Clash

The dispute focuses heavily on Operation Choke Point 2.0 records, which Coinbase believes involves targeted actions against crypto firms. The company believes regulators and the FDIC compelled financial institutions to cut off their services to digital asset businesses. 

Coinbase maintained that records play a crucial role in protecting their industry rights. Coinbase’s loss in court could impact how government agencies handle FOIA requests. This may influence the transparency of regulatory actions toward crypto businesses.

The legal victory in such cases will establish regulations for better transparency during industry interactions with regulators. After a legal win, other digital companies might follow the same method to demand accountability.

Per Coinbase, the FOIA procedures have become susceptible to manipulation, limiting necessary information access.

According to the firm, federal regulators should receive no protection from inspection because they use extended redactions and continual document delays. The method creates unfair competition for cryptocurrency market participants in the United States financial system.

Judge Rejects SEC Delay in Lawsuit

Coinbase is also pursuing another FOIA lawsuit against the SEC for withholding records tied to crypto enforcement. The firm argues that the SEC utilized public tax funds to finance multiple crackdowns on digital asset businesses. 

Coinbase fights to obtain all associated financial documentation supporting the enforcement measures regulators took against companies. Judge Ana Reyes rejected the SEC’s request for an extension on March 28, 2025. She also issued a warning about possible sanctions against the agency.

The April 11 deadline has been set as the mandatory date for the agency to produce all requested documents. This decision was a major legal success for Coinbase regarding its fight for increased government transparency.

The company observes SEC performance closely under the court order while warning that more delay might lead to fresh legal measures. The legal members of Coinbase maintain that complete disclosure is a necessary safeguard to protect American digital asset innovations. 

Under FOIA statutes, the exchange anticipates that federal regulators will operate within the law and fulfill their imposed obligations.

NY AG Warns Congress: Tether May Threaten U.S. Dollar Dominance

0

Key Insights:

  • New York Attorney General Letitia James urged Congress to regulate stablecoins issued by foreign companies like Tether.
  • She emphasized the need for stablecoins to be backed one-to-one by U.S. dollars or treasuries and held in U.S.-regulated banks.
  • James warned that Tether’s extensive holdings in U.S. treasuries could pose risks to financial markets during high redemptions.

New York Attorney General Letitia James has urged Congress to tighten control over foreign-issued stablecoins like Tether.

She cautioned that allowing unregulated foreign issuers could harm U.S. economic stability and weaken the dollar’s global position.

Her letter comes amid growing concerns about digital assets and their potential impact on traditional financial systems.

Tether’s Structure Sparks Dollar Dominance Concerns

Letitia James highlighted that Tether operates without direct U.S. facilities, making it challenging for regulators to oversee the stablecoin provider.

Bitcoin and precious metals are among the assets backing Tether’s USDT token, while the dollar equivalents typically used for backing are not exclusive.

The combination of assets creates instability for market participants throughout volatile periods until the rapid redemption period ends.

James emphasized that widespread, fast withdrawals of stablecoins in overstressed markets would adversely affect the treasury market.

She demonstrated how Tether’s mass selling of U.S. Treasury bills might significantly impair American debt markets.

The risk grows substantially because Tether maintains $94.5 Billion in U.S. treasuries.

According to James, when Tether makes hasty withdrawals from its treasury holdings, it could harm the liquidity of the U.S. financial framework.

Tether established its headquarters in El Salvador to relocate from U.S. jurisdiction.

By moving its headquarters to El Salvador, Tether increased worries regarding its accountability mechanisms and operational transparency.

AG Calls For Onshoring and Regulation of Stablecoins

AG James called on lawmakers to mandate that all stablecoins circulating in the U.S. be backed one-to-one by dollars or treasuries.

As per Letitia James, issuers establish operations out of U.S. locations while being fully regulated under state and federal oversight.

According to her correspondence, reserves must be kept safe at banks operating under U.S. regulatory authority to prevent international control.

The document argued that foreign stablecoins presented critical system-wide dangers; therefore, Congress should handle them in current stablecoin legislation.

Information controls must exist to sustain trust in U.S. dollars and financial institutions operating domestically.

Tether’s structure stands apart from these guidelines mainly because its diverse reserve composition lacks complete U.S. legal transparency.

Like previous investigations, the New York regulators accused Tether of presenting false information regarding its reserve assets in 2021.

According to James, the protection of financial stability requires Congress to fill gaps in digital asset regulation while developing the new legislation.

Circle’s Compliance Sets an Industry Example

USDC’s issuer, Circle, performs its operations under U.S. regulatory authorities while keeping the majority of its funds in dollar holdings and treasury bills.

Circle’s operational structure best fits James’s model by establishing itself as a safer dollar-backed digital asset choice.

The company maintains its U.S. presence to guarantee compliance with federal financial regulations and accountability.

Circle’s domestic oversight and public financial reporting process create steady public trust in its reserve system.

According to Circle’s operational model, stablecoins can function properly within the laws of the United States.

Circle’s approach to regulation functions as a blueprint for upcoming stablecoin solution providers who aim to establish long-term market reliability.

When discussing Circle’s model, James creates distinction through her examination of Tether’s foreign operations.

The approach taken by Circle supports policymakers’ view of it as a responsible innovation that aligns with national financial interests.

Unregulated Crypto Poses National Security Risks

James notified Congress about an impending danger that Bitcoin and similar cryptocurrencies presented to the supremacy of the U.S. dollar.

In her letter to Congress, she explained how Bitcoin allows value transfers without bank involvement, thus posing a threat to established financial infrastructure.

Unregulated changes like this one may affect U.S. economic power.

When combined with foreign stablecoins, Bitcoin’s decentralized system and unregulated manner create security issues regarding the nation’s defense establishment.

James explained that the dollar’s dominant status enables people worldwide to depend on American institutions.

The absence of regulatory oversight for digital currencies threatens trust between people and financial institutions, the AG noted.

According to James, she advised politicians to handle digital assets with care through established guidelines aimed at safeguarding U.S. economic stability.

In her view, the dollar’s status as the worldwide monetary priority remains essential for lasting fiscal protection.

Treasury Plans Review of Crypto Regulations

Treasury Secretary Scott Bessent announced a renewed effort to review blockchain and stablecoin regulations to encourage innovation while ensuring safety.

According to Bessent’s statements, the government is working to remove technical obstacles that do not impact economic stability.

The review regimen fundamentally safeguards consumer rights and, therefore, protects the nation’s essential financial obligations.

https://twitter.com/CarlBMenger/status/1909993952247243229

Congress must choose between supporting new technological growth or preserving established economic institutions as its next decisive act.

A balanced regulatory system enables both national goals to succeed independently of key national priorities.

Bitcoin Tests Key Support at $80K Amid Volume Surges & CME Gaps

0

Key Highlights:

  • Bitcoin is back under $80K; it tested its 50-week SMA and market structure.
  • Volume spikes suggest buyer strength as VWAP sits near $79.2K.
  • CME gap at $85.2K remains open as the price eyes key resistance levels.

Bitcoin has printed a second strong bullish candle. However, it now hangs on to the 50-week support zone. BTC is nearing a significant market structure and approaching the open CME gap at $85,245, reflecting intensified market activity. 

The surge in trading volume highlighted the test of key price levels. This signaled potential shifts in price dynamics.

Support for Bitcoin Seen Near $69,500 on Mayer Multiple Chart

Glassnode’s Mayer Multiple chart provided a long-term view of Bitcoin price concerning its 200-day moving average (200DMA). 

At the time of writing, BTC was trading at $79,510.28, while the 200D MA was at $85,067. This indicates that Bitcoin is still below a significant trend resistance.

bitcoin price
Bitcoin Mayer multiple | Source: Glassnode

Support was near $69,519, the 0.8 oscillator band in the chart. The red upper band, the 2.4 oscillator, suggested a top in the works near $208,557. 

In the past, when Bitcoin traded close to the lower oscillator (0.8), it was supported and recovered. Bitcoin has so far been contained within these bands, which may be a guide to future price action.

The Mayer Multiple itself is the current price divided by the 200DMA. It helps to show when Bitcoin is overbought or oversold relative to long-term trends. 

As the price is below the 200DMA, the market could still be in a consolidation phase. Also, a move above the 200DMA could indicate renewed strength.

Volume Spikes and VWAP Fluctuations Signal Active Buying

Meanwhile, CryptoQuant’s VWAP and 24-hour price change chart indicate that April has returned to active trading. Bitcoin printed two bullish “mega candles” with high volume on two separate occasions, marked as #1 and #2. 

The orange bars above the 240K BTC mark were the first spike. This spike came around April 7th and another one around April 10.

Bitcoin VWAP and 24h change analysis
Bitcoin VWAP and 24h change analysis | Source: CryptoQuant

During these moves, Bitcoin moved from a low of nearly $74,900 to a short-term high of $83,500. The VWAP (Volume Weighted Average Price) is the blue dashed line sitting near $79,200. 

As VWAP is a measure of average price based on volume and price, trading above it usually means buyers are in control. The volume surges and sharp price recoveries imply buyers are actively near current prices. 

More support is needed if the price remains above VWAP and the volume is high. However, traders may wait for a lower entry or confirmation of trend continuation if volume weakens.

BTC Battles Major Support—A Break Could Bring 2-Year Trendline Into Focus

Moreover, Bitcoin’s current price action tests the 50-week Simple Moving Average (SMA), a central long-term trend line. According to Titan of Crypto’s analysis, the token is also close to an area of past market structure. 

Source: Titan of Crypto/ X

This is the support structure that was created by previous price tops. Long-term investors may be encouraged to buy further if the 50-week SMA holds. 

If Bitcoin price drops below this level, the 2-year trend line becomes a key area to monitor. Another crucial zone is the lower edge of the Ichimoku Kumo Cloud.

The Kumo Cloud can be both support and resistance, depending on the price trajectory. A deeper pullback or longer consolidation may result from a breakdown into the cloud.

CME Futures Gaps Provide Short-Term Price Targets

Furthermore, Titan of Crypto also has another chart showing Bitcoin’s CME Futures price gaps. These gaps are created when Bitcoin closes at one price and opens higher or lower the next trading day. 

The chart showed one gap, nearly $82,300, that has been filled. However, there was another gap that is still open at $85,245.

bitcoin usd
Source: Titan of Crypto/ X

Markets tend to ‘fill’ these gaps by revisiting those levels, and these gaps often attract price. Resistance could be found if the price gets here unless volume and momentum are substantial.

Futures gaps do not always fill immediately, but many traders watch them as essential levels. This could be a move toward $85,245. It aligns with the resistance from the 200DMA mentioned earlier, a critical zone in the short term.

Ethereum OG Sells After 2 Years—Is A Bigger Crash Incoming

0

Key Insights :

  • An early Ethereum adopter sold over 10,000 ETH after two years of wallet inactivity, raising market concerns.
  • The transaction amounted to approximately $16.86 million at an average price of $1,576 per ETH.
  • The seller originally acquired the ETH in 2016, when the price was only $8 per token.

An Ethereum early adopter has sold over 10,000 ETH, triggering concerns across the crypto market. Blockchain analytics platform Lookonchain reported this major move alongside several other large Ethereum transactions. It comes during a period of increased volatility, declining network activity, and negative sentiment among some investors.

Ethereum Whale Sells $45 Million in ETH

A major Ethereum holder sold 28,999 ETH worth about $45.2 million, according to Lookonchain. The ETH coin holder conducted the sale as a debt repayment mechanism at an average rate of $1,559 per ERC-20 token. The whale transaction carried great weight because of its extensive size, which could affect market sentiment.

Source: X

Due to their size, large whale operations can affect both market price actions and upcoming trends. Market pressure on Ethereum’s price grew stronger due to this particular sale. Traders paid close attention to additional whale transactions because Ethereum was unable to sustain prices higher than $1,500.

Lookonchain documented multiple strange transactions related to Ethereum during that same timeframe. Several transactions originated from earlier dormant wallets while the funds moved toward decentralized lending interfaces. 

Those transaction patterns made investors question how much faith their peers had in Ethereum and its potential short-term performance.

ETH OG Sells 10,702 ETH Profitably

The Ethereum “OG” owner of ETH from 2016 sold 10,702 ETH worth $16.86 million, according to Lookonchain. The average price of $1,576 per ETH led to a profitable transaction, netting nearly $16.86 million from the initial $8 purchase. The wallet remained inactive for two full years before that transaction.

Source: X

The owner of Ethereum had retained their coins since 2016 because they had never sold at market peaks above $4000 per ETH. Since market downturns began, the investors have consistently followed a strategy of selling their holdings. The method used by this investor stands in opposition to traditional peak-time selling methods.

Expert observers raised suspicion about the choice of time for the transaction because this point may reflect bigger market-related factors. When the sale occurred, the marketplace showed decreased network operations and a deteriorating investor attitude. During the time of the sale, the Ethereum token maintained a market value that was lower than the prices recorded in previous periods.

On-Chain Data Signals Ethereum Weakness

The current Ethereum prices remain below the realized price value because it includes the average cost of all existing tokens. The price has typically fallen from 35 to 51 percent when it drops below that measurement point. The current market price might experience further decline under current circumstances.

CryptoBusy established several on-chain indicators that signaled bearish price predictions for Ethereum. During the last two weeks, Ethereum ETFs released $94.1 million from their funds. Institutional buyers seem to reduce their crypto exposure because of rising market doubt.

The decrease in Ethereum’s network activity amounts to 33%, and the transaction count has suffered a reduction of 40.5%. That demonstrates user disengagement from the Ethereum platform. The declining drop in user numbers signals people are moving toward other Level 1 blockchain networks. The market situation might persist at a standstill or drop even lower because of decreased interest.

Technical Indicators Suggest Ethereum Support Forming

Some analysts predict more price declines, while other analysts think the market presents a collection phase. TraderPA declared the present market correction to be a “Golden Opportunity” based on previous Ethereum price behavior. The study demonstrated previous market trends, which indicated robust market recovery periods following significant price decreases.

Source: X

According to Crypto Fella, the market could finish its descent due to technical indicators suggesting support is forming. Market analysts believe that the important price regions support Ethereum’s ongoing assessment. Although they maintain a safe approach, their general outlook on the market remains positive.

Source: X

Various specialists believe the current market conditions are unstable according to their perspective. CryptoBusy presented multiple bearish signals because both funding rates and investor interest were on negative trends. The signals could maintain downward pressure on Ethereum’s currently reducing market value.

Source: X

Kraken Co-Founder Moves Funds

According to recent records, the co-founder Jesse Powell of Kraken transferred 1,501 ETH to both Aave and Compound platforms. The exchange worth $2.46 million took place while sentiment was declining during the same period. The reason behind this transaction remains unknown, even though it happened during large Ethereum funds transfers.

The wallet transactions of Powell set off a series of hypotheses among analysts regarding his insider trading capacity and changing investment portfolio structure. This strategic time frame intensified the existing appraisal of short-term issues affecting Ethereum’s stability. Experts still monitor if large entities like Powell display supplementary indications of their market activities.

World Liberty Financial declared to its investors that they were selling their entire Ethereum token collection, according to official statements. These smaller transactions added to the general decline in institutional confidence, although they were not on the same scale. Market analysts track indications that point to fundamental network changes or temporary movement adjustments between repositioned market participants.

21Shares Unveils DOGE ETP—Will Meme Coin Mania Hit Wall Street

0

Key Insights:

  • 21Shares submitted filings to launch a Dogecoin Exchange-Traded Fund in the United States.
  • This DOGE ETF would allow investors to gain indirect exposure to Dogecoin through a regulated financial product.
  • The proposed fund is going to track the CF Dogecoin-Dollar Settlement Price and is awaiting SEC approval.

21Shares has submitted filings to launch a Dogecoin Exchange-Traded Fund (ETF) in the U.S., marking a bold step forward. This move signaled the start of a new chapter for the popular meme coin as it entered traditional financial markets. 

As the regulatory momentum is shifting, Dogecoin could gain legitimacy. Moreover, it could reach a broader base of institutional investors through this DOGE ETF.

Dogecoin ETF Gains Regulatory Momentum

The U.S. Securities and Exchange Commission (SEC) has accepted both the S-1 and 19b-4 forms submitted by 21Shares to list a spot Dogecoin Exchange-Traded Fund. A spot Dogecoin Exchange-Traded Fund needs these official records for approval in the country. 

This DOGE ETF fund’s subscribers can indirectly invest in the meme coin at the CF Dogecoin-Dollar Settlement Price.

This development provides investors an opportunity to access Dogecoin without worrying about digital wallet management and private key administration. This product’s regulated structure is going to enable investors to gain access to DOGE through safe, legal measures. 

Once the ETF gets approval, investors can gain confidence and increase their participation in this marketplace.

When writing, 21Shares is the third company to file for a Dogecoin ETF after Grayscale and Bitwise. The SEC starts its official assessment by accepting submissions 19b-4, which specify proposed regulations. 

The assessment process for cryptocurrency exchange-traded funds (ETFs) extends into an unknown timeframe. Market participants also expect growing support for these products.

Coinbase Chosen as Dogecoin Fund Custodian

21Shares Dogecoin Exchange-Traded Product (ETP) was launched simultaneously with the U.S. Exchange-Traded Fund (ETF) application on the SIX Swiss Exchange. As a result of collaboration with the House of Doge, the new ETP received support from the Dogecoin Foundation. After that, its development was also finalized. 

The ETP is the initial cryptocurrency product to be directly associated with the foundation behind its creation.21Shares achieved global market expansion for Dogecoin by obtaining a listing on the Swiss Exchange for their ETP product. 

The listing has secured regulatory status through Swiss regulation, allowing European investors to access this product. 

Coinbase has been designated as the hedge fund custodian responsible for both the ETP and the proposed U.S. ETF. It will likely enhance institutional investor confidence. 

The security of the exchange platform and higher investor trust result from having major U.S. exchange custody of assets. 21Shares and the House of DOGE are planning promotional work together once the U.S. ETF gets approved.

Dogecoin Shows Bullish Trend, Says Analyst

The cryptocurrency expert Kevin Capital identified positive trends within Dogecoin’s token price charts. A technical resurgence occurred when Dogecoin recovered from its previous position at $0.14. The analyst anticipates these positive market patterns will boost Dogecoin price within the next short period.

doge price
Source: X

The crypto market expanded after political changes. Investors responded optimistically when Former President Trump declared a 90-day temporary delay for tariff implementations. 

Dogecoin, Bitcoin, and Ethereum price surges totaled more than ten percent. This market-wide bullishness elevated Dogecoin beyond 12%. Solana also witnessed a 14% gain in value. 

Kevin Capital reported that cryptocurrency had increased upward before the tariff announcement. The DOGE crypto received additional market strength from the approval process of the DOGE ETF.

Dogecoin ETF Approval Odds Increased Significantly

The SEC’s leadership shift may be key in future ETF approvals, including the one for Dogecoin. Paul Atkins has been confirmed as SEC Chair, with Senate approval secured in a 52-44 vote. Atkins is widely viewed as a cryptocurrency innovation and financial technology supporter.

Under previous leadership, the SEC delayed decisions on several ETF proposals for coins like Litecoin, Solana, and XRP. Those delays created uncertainty around the approval timeline for crypto ETFs. 

However, Atkins’ confirmation may accelerate the review process and increase the chances for approval. Bloomberg analysts estimate that there is a 75% chance that the DOGE ETF will be approved within the year. 

That’s a notable increase in confidence in comparison to earlier forecasts under more cautious leadership. 

Companies are consistently submitting crypto ETF applications. It signals their belief in regulatory progress. 21Shares has not limited its ETF ambitions to Dogecoin alone, expanding its reach into other digital assets. 

Earlier this year, the firm filed for spot ETFs focused on Polkadot (DOT) and XRP. These filings align with broader applications as firms test the SEC’s regulatory stance.

James Seyffart, a Bloomberg analyst, described the recent flood of applications as a strategic move by ETF issuers. With new leadership, companies see an opportunity to introduce diverse crypto products. They are racing to be first to market if regulatory conditions become more favorable.

XRP Price Drops Below $2 While Futures Volume Peaks At $21.6B

0

Key Insights:

  • XRP price fell below the $2 mark, signaling increased bearish sentiment in the market.
  • The token is trading at around $1.96 after dropping 4.02% in the past 24 hours.
  • XRP has recorded a 12.51 percent decline year-to-date, placing it in the red for 2025.

XRP price had a turbulent start to April, facing a sharp price drop. A sudden surge followed this in trading activity.

The token broke below the $2 mark, triggering bearish sentiment, while its futures volume soared to a new monthly high. Despite a rise in on-chain metrics, indicators suggest continued market pressure and potential downside ahead.

XRP Price Breaks Below $2 as Bearish Momentum Strengthens

XRP price dropped below the essential $2 mark. This demonstrated growing sell-off momentum and traders’ growing skepticism about market conditions. 

During the previous 24 hours, XRP lost 4.02% of its value when trading at a current market price of $1.96. The token indicated negative yearly performance because it has declined by 12.51% since the beginning of the year.

XRP’s previous resistance has given way to the diminished short-term sentiment that emerged through recent market developments. The heightened market volatility caused traders to make successive daily price declines. 

XRP’s market value decreased by 13.36% during the previous week. This strengthened predictions about its continuous descending trend.

According to technical indicators, trading momentum has changed because XRP stays under its twenty-day average mark of $2.155. The Bollinger Band indicator displays rising market volatility because the lower limit is $1.781. 

The current price range implied that XRP price may fall to additional support levels whenever market sellers intensify.

Futures Volume Reaches $21.6 Billion Following ETF Launch

XRP futures trading volume achieved its highest monthly level on April 8. At that time, it surpassed the amount from Monday by $500 Million at $21.6 Billion.

xrp future
Source: X

Numerous traders started buying the Teucrium 2x XRP ETF when it was launched in the market after its release. Analysts identify the new listing as the main reason behind the sudden increase in volume.

Leveraged ETFs employ derivatives, possibly leading to a dramatic increase in XRP futures market transactions. Recent address data indicated that retail participants mainly drive market activity. 

Institutional participants may be entering, but their involvement remained lower than that of retail consumers. The broader market exposure from XRP provides opportunities for new speculative buying pressure in the XRP asset class.

XRP long/short
XRP long/short | Source: Coinalyze

The heightened volume does not indicate panic selling because holders maintain long futures positions. According to market analysis, the current holding of long positions in the futures market makes up almost 68% of the total positions. 

The current market positioning revealed uneven trader commitment to XRP price decline. This suggests varying sentiments and strategies among participants.

XRP Key Indicators Signal Persistent Weakness Despite On-Chain Growth

The RSI value was recorded at 42.75, signaling neutral-to-bearish market conditions. It also showed signs of weakening momentum and the possibility of downward pressure. The bulls do not control the market since the scoring remained below 50. 

The RSI-based moving average stood at 39.65. This highlighted ongoing bearish signals. Meanwhile, the MACD lines confirmed the bearish outlook, indicating -0.10976 and -0.09547 values. 

The current negative value in the histogram showed no indication of a bullish crossover, thus indicating downtrend persistence. The market stayed cautious because there has been no indication of upcoming short-term price reversals.

XRP/USD 24-hour price chart
XRP/USD 24-hour price chart | Source: TradingView

On-chain metrics reveal that the number of XRP addresses holding at least $1 worth of tokens has reached an all-time high. This surge contradicted professional analysis, highlighting a divergence in market perspectives.

The rising number of market participants demonstrates how retail investors enter the market during price decreases. The positive metric fails to prove an immediate price increase in the market.

XRP Price Faces Pressure Below Key Resistance

The current market condition for XRP presented a high risk. Most technical indicators signal bearish tendencies, and traders predict additional price drops. 

The current market doubt stems from active weakness in crypto assets and stock market performance. A previous rebound attempted during this month proved short-lived. This indicates an upcoming extensive price correction may take place.

The bearish crossover on the MACD and sustained pressure below the 20-day moving average show a lack of buyer support. XRP price faced significant barriers to upward movement if it stayed under the main resistance point of $2.155. 

XRP holder acquisitions suggest enduring interest in the long term. However, that might not shield it from current market threats.

XRP is increasingly likely to experience a sharp price correction. Downward market pressure could push it toward $1.781, aligning with its lower Bollinger Band range. Traders need to pay attention to technical levels and volume patterns to find indications of price recovery.

Bitcoin Bleeds: CryptoQuant Says 1 In 4 Holders Are In The Red

0

Key Insights:

  • Over 26% of the total Bitcoin supply is currently held at a loss, according to CryptoQuant data.
  • The percentage of Bitcoin in loss has risen sharply from just 1.46 percent in January to current levels.
  • Many investors bought Bitcoin during the late 2024 rally and are now facing unrealized losses.

Bitcoin recently experienced renewed pressure as market volatility pushed many investors into lost territory. Recent data from CryptoQuant confirmed that over 26% of the circulating Bitcoin supply is now held at a loss. 

This trend reflected a sharp shift in sentiment. Just a few months ago, nearly all holders were in profit.

Bitcoin Slips as Over 26% of Supply Sinks Below Purchase Price

The number of Bitcoin holders in the red has climbed to 26%, indicating growing pessimism across the market. As recently as January 18, only 1.46% of Bitcoin was held at a loss, showing how quickly conditions have changed. 

Market direction underwent a sudden transformation. This caused Bitcoin to hold at a loss and plummet to 0.015% in mid-December.

According to CryptoQuant data, underwater supply expansions are linked to current macroeconomic trends and investors’ market purchase points. Many investors bought Bitcoin during the late 2024 rally when prices surged to near-record levels. 

Investors acquired at high market points now watch their assets devalue since the prices have dropped below their original buy-in amounts.

Bitcoin Drawdown Since 2023 | Source: CryptoQuant

At press time, Bitcoin price hovered around $76,880, down 3.7% in the last 24 hours. The number of holders in loss positions has now reached September 2024 levels. However, the value of their holdings remains elevated from that period. 

Recent investments demonstrate the effects of purchasing from the last price upswing at high values.

Bearish Technicals Reinforce Market Uncertainty

Bitcoin has faced strong resistance from key exponential moving averages. They are now capping any attempts at recovery. The price stayed beneath the 20, 50, 100, and 200-day EMAs as these indicators maintain a range between $82,591 and $88,049.

Every time Bitcoin fails to surpass these resistance levels, the market downturn continues with increased strength. Market momentum indicators currently indicate additional downward pressure for Bitcoin prices throughout the brief term. 

Traders consider the market conditions balanced with an RSI reading of 46.60. On average, the RSI indicator at 43.33 supports this perspective. Similar to previous indicators, selling power dominates over buying power in the market movement.

BTC/USD 24-hour price chart
BTC/USD 24-hour price chart | Source: TradingView

The MACD indicators showed negative signals. This happened as the MACD line maintained a position of -1,588 below the signal line at -1,454. 

The current reading in the histogram stood at -135. This confirmed that downward price mobility remained active in the market. The probability of testing lower support remains high unless Bitcoin can close decisively above the EMA resistance cluster.

Institutional Outflows Deepen Bitcoin’s Decline

Institutional investors have shown reduced interest, further adding to Bitcoin’s weakness. Farside Investors said $326.3 million flowed out of Bitcoin ETFs yesterday alone. 

The Crypto market experienced a continued drain for seven straight trading days after the last eight sessions. The regular transfer activity showed that massive investors have decided to decrease their holdings or cash out. On the other hand, uncertainty prevailed in the market. 

Institutional investors’ selling contributes to retail investors’ market declines, thus influencing broader market opinion. The thinning of liquidity creates stronger resistance to recovery attempts in the market.

Market participants have adopted a holding position while they watch for steady market indicators that indicate entry points. ETF investment activity remains stagnant because market participants believe the near-term market recovery will not happen any time soon. 

With global macroeconomic conditions weighing heavily, Bitcoin faces additional barriers to a sustainable recovery.

Bitcoin’s Position Remains Stronger Than Past Lows

While 26% of Bitcoin’s supply is lost, the overall investor base is in better shape than during previous downturns. In November 2022, when the FTX collapse rattled markets, over 56% of Bitcoin holders were underwater. 

The present investor base retains better stability than previous market lows, even during this persistent correction period. Investors who bought Bitcoin before the 2024 bull rally phase continue to experience market advantages in the existing conditions.

Most investors who entered before recent buyers continue to have profitable positions, although new investors face losses. The supply of underwater crypto assets remains near recently established entry points. The timing of their entries heavily influences investors’ market positions.

$414M XRP Token Transfer Sparks Speculation On Kraken’s Role

0

Key Insights:

  • A $414 Million XRP transaction between two unmarked wallets has stirred interest in the crypto market.
  • The transfer occurred on Wednesday at 11:23 UTC and involved 230.77 million XRP.
  • On-chain data suggested that both addresses involved in the transfer are linked to the Kraken exchange.

A massive on-chain XRP transaction valued at $414 Million has drawn significant attention. This unusual activity has ignited fresh discussions within the cryptocurrency market.

Midweek, the shift between two unmarked wallets drew quick attention from blockchain trackers. Despite ongoing price pressure, XRP showed momentum as traders monitored key technical levels.

Large XRP Movement Raises Eyebrows Amid Exchange Links

At 11:23 UTC on Wednesday, a bulk XRP transfer of 230.77 million XRP shifted from two non-disclosed wallets. Whale Alert noticed the transaction because it sent 230.77 million XRP from “rp7TCc” to “rHapXG.” During the transaction execution, the money exchanged was above $414 million.

Investigations revealed that the San Francisco-based cryptocurrency exchange Kraken managed both addresses. It was confirmed that they began utilizing the sender’s wallet in December 2024.

Bithomp demonstrated that the wallet frequently engages with the Kraken platform through its data analysis. This suggested a significant presence of exchange. The wallets have no official markings, yet the recorded blockchain events connect to internal company operations.

The wallet receiving the XRP only engaged with one single transfer for a minimal amount before the latest transaction occurred. The address handling the prior XRP transfer received the funds because it activated them, making a strong case for internal management. 

Commercial analysts believe the recent XRP transaction is part of Kraken’s strategy to manage its exchange liquidity. This aligns with Kraken’s focus on maintaining efficient operations and market stability.

XRP Price Attempts Recovery After Recent Weakness

XRP experienced price fluctuations, stabilizing after reaching its intraday minimum value of $1.7216. The token gained more than 6.4% starting from that support level and trades in the $1.8338 area. 

Although it has moderately recovered, the price remains below the essential resistance threshold of $2. Cryptocurrency suffers from poor performance because of concerns emerging from the unresolved global economic disputes between the US and China. 

Although prices have recovered with increased trading volume, retail and institutional trader interest grows steadily based on short-term market data. The market is conservative, although technical data suggests a breaking point could appear soon.

A price rally of XRP will likely occur if it surpasses upcoming resistance levels but sustains current holding prices. Market indicators displayed a reduced willingness to sell, and a potential upward price momentum will occur after breaking above $2. 

The price demonstrated strong potential for further acceleration as the quarter progresses. This trend reflected growing optimism in the cryptocurrency market.

Technical Patterns Indicate Key Support and Possible Reversal

According to a technical analyst, XRP price was found resistant at the $1.81 support mark, which stands against price decline. The price support was an essential barrier against falling to the following crucial support area at $1.71. 

Expert analysts suggested a temporary price drop when it passes beneath this critical area. Elliott Wave theory suggested a potential “Wave 3” bearish movement for the token unless the price stabilizes above existing market levels. 

Analysts predicted that the previous price movement from $1.72 adds strength to the $1.71 support zone. This will act as temporary resistance. XRP may challenge the significant support area at $1.55 after failing to defend its current position.

xrp price
Source: X

Expiring correction patterns often signal their final stages at this retracement level. This stage typically marks the onset of an upward price movement, suggesting a potential market recovery.

Market analysts suggest XRP could initiate an upward trajectory toward $4.5 and beyond. This potential rise hinged on the $1.55 resistance area, maintaining its strength. The market carefully expected signals for an inversion of current trends to occur.

Market Outlook and Price Predictions Remain Mixed

The short-term projection for XRP showed unclear signs because various indicators from on-chain metrics and chart analysis present contradicting information. The movements of large wallets on Kraken generate close trader observation since they often signal upcoming market trends.

A price rise delay is probable without substantial external money flows. Expert analysts anticipate that XRP could hit $4.5 in its ongoing market cycle. This projection depends on a recovery in market momentum and the successful breach of key resistance levels.

The longer-term potential for price growth is $17, while $45 is a target when general market conditions strengthen. Forecast models depend on general market developments and the token’s capacity to win back its investors.

The price volatility problem continues due to irregular trading volume movements near support zones. Institutional investment could return if XRP’s price maintains higher levels above $2. 

Market observers maintain a moderate sense of hope while tracking market technical data and blockchain transaction patterns.

DOGE Whales Dump $1.3B While Wyckoff Spring Fuels Bullish Hopes

0

Key Insights:

  • Whales offloaded 1.32B DOGE in 48hrs, sparking market shake-up.
  • DOGE tests a rising trendline at $0.13 near the key 61.8% Fib level.
  • Wyckoff Spring is in play as DOGE mirrors the accumulation structure. 

Dogecoin (DOGE) has come under pressure with broader market pullback as President Trump announced fresh U.S. tariffs. In the past week, Dogecoin price has fallen by over 12%. 

After reaching a local high of $0.48, the price has corrected by 70% to the current value of $0.1452. Nevertheless, the token prepared for a possible recovery phase even with this correction.

Whale Sell-Off Contributes to DOGE Price Decline

Data from Santiment showed that major DOGE holders, known as whales, have sold over 1.32 billion DOGE in 48 hours. These are those wallets that hold over 1 billion tokens each. 

According to the data, their holdings dropped from approximately 72.9 billion DOGE to around 70.88 billion DOGE. This suggested selling pressure.

dogecoin price
DOGE Holders over 1 billion tokens | Source: Santiment

When this sell-off occurred, DOGE fell from around $0.18 to a low near $0.131. This move implied that these large holders contributed to the downward trend in early April. 

When demand from buyers doesn’t match the volume sold, such selling activity can weigh heavily on price. Meanwhile, the overall whale wallet behavior has consistently reduced from late March until the start of April.

The current wallet holdings have returned to levels observed earlier. These are similar to the levels seen before the March rally began.

Key Support Found at Fibonacci and Trendline Confluence

Meanwhile, according to technical analysis, Dogecoin may be close to a strong support zone. Analyst ali_charts showed that since October 2023, DOGE has respected an ascending trendline. 

Dogecoin
Source: Ali Charts/ X

This trendline is near the 61.8% Fibonacci retracement level, which is at $0.13041. The Fibonacci retracement measures how far the price could retrace from a recent move. 

The support level on this level, around $0.13, has been a support level in previous corrections. Technical strength is added by the convergence of this level with the long-standing trendline. 

At press time, DOGE was trading around $0.1437, just above this critical area. The token was expected to rebound to $0.168 and $0.212 levels. 

These levels corresponded to 0.5 and 0.382 Fibonacci levels if it maintained its position. Once recovery began, these levels served as resistance points.

Wyckoff Accumulation Pattern Shows Early Reversal Signs

Additionally, TATrader_Alan separately analyzes Dogecoin’s current price behavior in a Wyckoff Accumulation pattern. This model describes five phases of a market bottoming before a new uptrend begins. 

doge usd
Source: Trader Alan/X

DOGE appears to have recently gone through the “Spring” phase. This phase was characterized by a false breakdown followed by a subsequent recovery. According to his analysis, the price moved into the early part of Phase D. 

This part consists of “Last Point of Support” (LPS) and “Sign of Strength” (SOS), which meant buyers were taking over. If DOGE continues on this path, it may test resistance near $0.18 again. This may even rise higher to $0.21 in the coming weeks.

The pattern was not entirely well-defined. Specifically, Phase B showed slightly elevated prices, deviating from a typical Wyckoff setup. However, the structure was largely consistent with an accumulation phase.

Technical Indicators Show Bearish Momentum but Possible Rebound

Furthermore, technical indicators indicate that bearish momentum may be easing. On the 1-day chart, the MACD showed that the MACD line is at -0.00948, above the signal line at -0.01102. 

This narrowing gap usually indicates a decrease in bearish momentum. A crossover could mean a change to a bullish movement.

dogecoin price
Dogecoin momentum indicators | Source: TradingView

Meanwhile, the RSI (Relative Strength Index) was at 40.75. This value was near the oversold threshold of 30, indicating that the selling pressure could be easing. 

If the RSI goes above 50, it would indicate that buying strength is increasing. The daily chart of DOGE also had a green candle, suggesting a bounce from the $0.136 level. This was in line with the notion that buyers are entering near-key support.

SOL Price Faces Sell-Off As Adoption and Privacy Features Grow

0

Key Highlights:

  • Whales sell over $15M in SOL, pushing the price near $101 before a minor bounce.
  • Analysts watch $74 and $50 as key support zones for price stabilization.
  • Active Solana addresses cross 9M as DeFi volume sees strong 10-day growth.

At press time, Solana was under pressure,losingt nearly 4% in the last 24 hours. When writing, SOL price was $106.71, down 3.87% in the previous 24 hours. 

Trading volume rosy 8.83% to $5.58 Billion, while market capitalization dropped 0.7% to $55.03 Billion. Solana has a weakness in this price area but still has strong user growth.

SOL Price Reacts to Whale Selling and Bearish Momentum

In the last 24 hours, large Solana holders have been selling large amounts of SOL. Wallet “4W1Ree” unstaked 159,028 SOL worth $16.5M. It sold 60,000 SOL for $6.13M at $102. Meanwhile, wallet “5cPair” sold 89,734 SOL for $9.67M at $10

sol price
Source: X 

The combined selling of more than $15 Million in SOL put more pressure on an already falling market. According to CoinMarketCap, SOL price reacted by falling from levels near $110 to intraday lows around $101. 

Even at the end of the London trading session, selling dominated. However, there was a mild bounce. Additionally, the Awesome Oscillator (AO) indicator oSolana’s daily chart also showsing strong bearish momentum at -17.24. 

The Stochastic RSI was slightly up at 23.09 and 21.92. This indicated early signs of recovery but still in the oversold territory.

SOL Price Breaks Key Support Amid Concerns of Further Decline

Since early 2024, SOL price has held above a horizontal trendline. It has even managed to stay strong through more significant market corrections. 

However, a decisive break below this support has resulted from the recent drop relating to President Trump’s ‘Liberation Day’ announcement. The move has raised concerns about SOL’s ability to hold its current levels. If it fails to do so, further downside could follow.

SOL Usd
SOL/USD | Source: TradingView

According to TradingView data, SOL pricd hinearlyar $300 before dropping to the $100–$107 range. Now, this area has become a critical short-term threshold. 

sol price
Source: Ali charts/X

However, analysts warn that losing this zone could lead to another 20% decline. Going forward, this could take the price down to $85 or below. According to Ali Charts, key Fibonacci support levels are $74.11 (0.382 Fib) and $50.18 (0.5 Fib). 

These levels may become important if the downtrend continues. Below that, the next level is at $33.98, the 0.618 retracement level from the larger move that started in early 2023.

Despite Market Pullback, Network Usage Surges

Price action is weakening, but on-chain activity tells a different story. According to data from Glassnode, active addresses on the Solana network spiked to over 9 million. This is massivege increase from previous months.

Solana active addresses
Solana active addresses | Source: glassnode

Furthermore, Solana’s decentralized trading activity has grown rapidly. DefiLlama reported that volume on DefiDotApp doubled in the last 10 days. This implied that even though prices are down, user interest and network demand are up.

Solana defi trading volume
Solana defi trading volume | Source: DefiLlama

Even as SOL price has declined, these numbers show growing adoption. It could provide long-term support as more users and developerinteractng with the ecosystem.

Confidential Balances Go Live on Solana

Solana has introduced a new privacy feature called “Confidential Balances.” This feature is powered by zero-knowledge (ZK) technology to enhance user privacy. The encrypted token balances are now live on Solana’s mainnet.

solana price
Source: X 

The feature enables institutional users to hide the token amounts from the public view while maintaining compliance with regulatory standards. The developers of Solana say this privacy extension allows for “sub-second finality” and business-grade confidentiality.

The addition of Confidential Balances makes Solana the firssignificantor blockchain with live encrypted tokens powered by ZK. This could draw more interest from the enterprise, especially in the financial sector.

Peter Schiff Mocks Bitcoin Reserve As Recession Fears Intensify

0

Key Insights:

  • Peter Schiff criticized the US government for creating a Bitcoin reserve. He pointed out that the reserve’s BTC value had dropped 12 percent.
  • He stated the country could have gained 2 percent if it had sold Bitcoin and invested in gold instead.
  • Schiff believes the current crypto regulation approach weakens the government’s financial credibility during uncertain economic times.

Peter Schiff has renewed his criticism of the United States’ decision to form a national Bitcoin reserve. This time, in his criticism, he cited recent market losses. 

He claimed the reserve has already suffered a 12% value decline. This could have been avoided with a gold-focused strategy. 

This critique arises from growing worries about the economy’s stability. It also reflected heightened market volatility driven by trade policy changes and recession risks.

Peter Schiff Criticizes US Bitcoin Reserve

The US established its Bitcoin Reserve on March 6, 2025, as part of a new digital asset initiative. Economics expert Peter Schiff stated that the US government’s Bitcoin reserves have lost over 12%. This decline has occurred since the reserves were first established.

Schiff compared the performance of Bitcoin to gold over the same timeframe and noted that gold had gained approximately 2%. According to his analysis, the government could have earned profits through BTC trading followed by Gold investment. He stated,

 “So far, the value of the Bitcoin held in that reserve has declined by over 12%. The United States could have eliminated the Bitcoin loss of 12% because selling BTC would have allowed the purchase of additional gold within our reserve to produce a 2% increase.”

Bitcoin Reserve
Source: X 

Despite the recent Bitcoin rebound to $80,000, Schiff questions the logic behind government-led crypto exposure. Schiff believes the situation demands stable macroeconomic stability since short-term profits cannot outweigh long-term security. 

Critics argue that the revealed flaws in crypto regulations highlight weaknesses in the system. They believe this exposes the government’s inadequate approach to regulating cryptocurrency.

Schiff Warns of Deepening US Recession

Schiff evaluated the performance metrics of the Bitcoin reserve alongside a Trump economic plan assessment that suggested rising recession risks.

He argued that Trump’s proposed tariff increases included 50% levies on Chinese imports. This may cause additional instability in an economically unstable system. 

Schiff said this economic slump would become the most serious since the Great Depression. Peter Schiff argues that the current market value of stocks surpasses realistic asset valuations. He attributed this to the lack of a market correction following new trade policies.

He anticipated a significant decline in stock prices exceeding 50% when economic recession indicators prove increasingly strong. Schiff advised investors to preserve stability by being cautious during the optimistic market phase following the cryptocurrency market recovery.

The expert criticized the Federal Reserve for its inability to stop the approaching economic slowdown. He said introducing new liquidity into the economy to prevent a recession could trigger hyperinflation instead of avoiding economic decline. 

According to Schiff, the economy will suffer a loss when monetary policy selects short-term relief instead of creating long-term resilience.

Crypto Regulation Lacking, Says Peter Schiff

Schiff maintained that gold provides better financial protection against economic instability and inflation risks. Rising gold values strengthened his longtime prediction. This demonstrated that traditional assets yield better results than speculative ones when markets experience upheaval. 

The US administration maintains a different policy approach from Schiff’s. When social media users pointed out missed Bitcoin gains under the previous administration, Schiff dismissed these claims. He labeled the comparisons as irrelevant to the current market context.

Per him, performance assessment begins at the reserve launch date and stops after the previous periods do not matter. The use of speculative profits lacks stability for establishing a national reserve system.

Schiff delivered evidence that an inadequate crypto regulatory framework causes markets to become more volatile. According to Schiff, the unpredictable nature of policy structures makes digital assets increasingly dangerous for national portfolio holdings.

His statements have reignited the debate on incorporating electronic money into official economic strategies. This discussion also touches on the role of the Bitcoin Reserve in shaping national policies.

Bitcoin Hits $80K Despite Schiff Warning

Despite Schiff’s warnings, Bitcoin recently surged to $80,000 after a sharp market correction. Broad economic conditions continue to present significant threats to investors, who remain wary of the situation. 

Experts state that although the market spike indicates robustness, it does not necessarily mean ongoing business growth. The absence of specific crypto regulations has raised investor stress because government-controlled portfolios include volatile assets. 

The combination of geopolitical tensions and unpredictable monetary policy changes severely increases market uncertainty. 

Schiff believes that current economic instability makes gold the preferred asset. He argues it offers better long-term value storage than a Bitcoin reserve

DOGE Price Teases $1 Dream—But Analysts Say Not So Fast

0

Key Insights :

  • Dogecoin surged from $0.11 to $0.46 in late 2024, sparking hopes of a $1 price target in 2025.
  • Analysts believe Dogecoin’s unlimited supply limits its potential to sustain high prices over time.
  • Long-term holders reportedly sell during rallies, causing repeated price drops and failed breakouts.

Dogecoin (DOGE) price recorded an impressive surge during the final quarter of 2024. The memecoin rose from $0.11 to $0.46. 

This rally sparked fresh optimism across the DOGE community, with renewed hopes of reaching the much-anticipated $1 mark in 2025. However, as the new year unfolds, strong headwinds and unfavorable conditions suggest the path to $1 remains uncertain.

DOGE Price Gains Momentum with ETF Prospects & Real-World Adoption

The recent DOGE price rally injected enthusiasm into the Dogecoin community. Many expected stronger upward momentum in early 2025. 

Investors saw rising application numbers from asset managers seeking to launch spot DOGE exchange-traded funds as a positive market indicator. An approved fund could boost institutional involvement, resulting in widespread product adoption.

Dogecoin
Source: X 

Crypto regulation is a primary element affecting how long it takes for ETF approval to be granted. Abnormal market predictions on Polymarket showed a 69% chance for the SEC to approve a DOGE ETF during 2025. 

Dogecoin is gradually gaining traction in retail, with companies like Tesla and Twitch accepting it for payments. Of course, more firms adopting DOGE as a payment method will improve the coin’s utility. 

The growth of actual-world adoption will lower market instability. On the other hand, it would offer better support for increasing price values.

Dogecoin Faces Challenges on Path Upward

Despite the renewed optimism, several analysts argue that DOGE price faces fundamental hurdles that could prevent it from reaching $1. Dogecoin’s unlimited supply diminishes its long-term value potential. In contrast, Bitcoin’s capped supply makes it more appealing to investors.

Numerous market analysts note that Dogecoin’s inflationary mechanism consistently pushes tokens into the market for sale. Long-time holders who purchased Dogecoin at bargain prices enter market trades at every price increase. 

The holders who acquired DOGE at its early price points tend to cash out when the value increases. This triggered price declines and caused the price to fail to break past resistance levels. 

DOGE has encountered barriers to price sustainability when facing resistance zones. This restricted its ability to move upwards. Regulatory frameworks play a significant role in shaping market dynamics. 

Their controlling measures particularly influence the performance of meme coins like DOGE. Due to undefined regulatory boundaries, high regulatory vigilance prevents institutional investors from entering meme-based assets. 

Bearish Technicals Reinforce Analyst Warnings on DOGE’s Short-Term Path

The 24-hour technical analysis supported the bearish sentiment expressed by many market experts. This added to concerns over DOGE price near-term prospects. 

Dogecoin displayed continued falling momentum. The token dropped over 4% to reach a price of $0.1436 during the latest daily market session. 

The market activity demonstrated weakness. This weakness came into play due to DOGE price remaining under all main exponential moving averages. Market data showed that all significant exponential moving averages operate above the current market position. 

The EMA system demonstrated an established downward trend. It required major momentum changes for market recovery. Traders view this chart configuration as a signal of upcoming market shifts. It suggests aggressive sellers might dominate the next trading period.

DOGE/USD 24-hour price chart
DOGE/USD 24-hour price chart | Source: TradingView

Both the RSI  together with the MACD displayed negative market sentiment. At press time, the RSI showed weak buying interest because its value of 33.71 indicated oversold conditions. 

The MACD line demonstrated negative short-term bullish signals. This is because it remained beneath its signal line.

Musk’s Silence & Tariff Tensions Add More Pressure to DOGE Price

The absence of Elon Musk’s vocal support for Dogecoin has also weighed heavily on investor sentiment in recent months. Previously, Musk’s comments often triggered significant DOGE price spikes, acting as a catalyst for rallies. 

Many retail investors demonstrate decreased investor interest due to Musk’s ongoing silence about Dogecoin. Some traders now argue that Musk’s lack of public endorsement may have permanently slowed Dogecoin’s mainstream momentum. 

According to previous reports, Musk’s limited involvement with the Dogecoin Foundation has also contributed to declining interest. The lack of influencer support means DOGE has lost its earlier advantages from the same level of influencer backing.

Solana Price Rebounds, Faces Uncertainty Amid Regulatory Concerns

0

Key insights:

  • Solana price rebounded sharply after a major correction, showing renewed strength and sparking investor optimism.
  • The coin regained over 12% in a single day, lifting its price back above the $108 level.
  • Technical indicators confirmed support zone strength and successful trendline validation, encouraging cautious buying activity.

Solana (SOL) price suddenly rebounded after a steep correction. This raised fresh hopes among investors anticipating an altcoin recovery. 

The crypto market suffered notable losses recently. However, Solana showed strong momentum in the past 24 hours. 

Rising volatility and shifts in sentiment add uncertainty to the short-term outlook. Concerns about global crypto regulation further complicate the market’s direction.

Solana Price Shows Bullish Signs After Drop

Solana price experienced a sharp 14% decline during the past week as bearish forces took over the broader crypto market. After a bearish market attack, SOL tokens regained more than 12% value that day.

This demonstrated strong market demand. This reversal brought SOL price back above $108, reviving discussions of a potential continued recovery.

Source: X

Market observers noted that the price action aligned with a crucial support zone. Solana managed it to hold despite recent selling pressure. A classic trendline validation test was successfully finished on the charts to empower additional bulls in the market. 

Solana Buy Volume
Solana Buy Volume | Source: Hyblock Capital

Enter buyers pushed the market toward recovery while they kept their moves conservative. Data from Hyblock Capital showed that Solana’s buy volume reached over 99. This suggested intense buying activity within a short timeframe. 

Such a reading suggests that retail traders and institutions have started showing interest. Analysts urge caution despite the promising data. Global regulatory shifts and macroeconomic challenges demand careful consideration.

SOL Long Positions Drop as Sentiment Shifts

The long/short ratio of Solana displayed considerable movement over the last five days. This suggested fluctuating sentiment among futures traders. 

The trend of long position contracts on April 5th reached a high peak. This became brief before positions faced a ratio decline to 0.80. Recent price increases failed to stop bearish market sentiment from improving.

Similarly, Binance’s SOL/USDT perpetual market highlighted a gradual decline in long account dominance since April 6th. 

Long/Short trading accounts moved from high numbers exceeding 5.0 to lower ratios near 3.0 by April 8th. This might show traders taking profits out of their positions.

SOL Long/Short
SOL Long/Short | Source: CoinGlass

Growing uncertainties in the market prompted traders to adjust their positions. Anticipation of forthcoming regulatory changes also influenced their strategies.

Binance has displayed this conservative approach because several national governments are developing their crypto regulations. This may have made traders less inclined to take risks. 

Multiple jurisdictions adopting regulatory oversight practices leads traders to consider/perceive higher financial and legal costs in their operations. Market speculations face reduced betting intensity despite positive price movements in the market.

Altcoin Season Still Unlikely Despite Solana’s Bounce

While Solana price recovery sparked optimism, broader indicators show that an altcoin season remains unlikely in the immediate term. Market dominance for Bitcoin remains strong because the Altcoin Season Index currently stands at 18. 

Most of the capital is flowing into Bitcoin instead of altcoins. Despite Solana’s bounce, the weak index reading indicates a limited appetite for widespread altcoin accumulation under current market conditions. 

Investors are reluctant to switch to different assets because they need additional monetary policy and regulatory transparency regarding cryptos. Investor risk tolerance remains low because this leads to limited mass investment that restrains substantial price gains.

Solana’s open interest, which dropped during last week’s price decline, hinted at a potential reversal but lacked strong follow-through. Both rising price levels and increasing open interest must be maintained for an extended period to validate strong, bullish market trends. 

Presently, mild optimistic sentiments regarding altcoins might be insufficient to start sustained price rallies. Though Solana’s recovery is a welcome sign, the crypto market remains fragile due to regulatory uncertainty and shifting trader sentiment. 

Crypto regulation is increasing its influence as authorities across regions prepare for stricter compliance frameworks. Investors and institutions alike are adapting strategies to navigate this evolving landscape.

Bitcoin Moves In Sync: S&P 500 & Nasdaq Still Call The Shots

0

Key Insights:

  • Bitcoin holds a $74.8K neckline in a parabolic pattern structure.
  • Correlation with the Nasdaq and S&P 500 remains near 0.8.
  • BTC price mirrors equity moves amid recent tech market pullback.

Bitcoin remained in sync with the U.S. stock market. Recently, CryptoQuant’s data revealed that BTC has maintained a strong correlation with the S&P 500 and Nasdaq Composite Index. 

This trend has persisted since late 2024, highlighting its connection to traditional markets. Both indices have a high degree of connection, and the correlation coefficient is around 0.8.

The OG token followed a similar move when the S&P 500 started recovering in late September 2024. Their paths were aligned as both assets climbed into early 2025. 

Also, Bitcoin and the indices fell almost in tandem, even during the recent correction. This pattern has persisted for several months, showing consistency. Bitcoin continues to respond to overarching risk trends in the financial markets.

Bitcoin price & the Nasdaq composite index correlation
Bitcoin price & the Nasdaq composite index correlation | Source: CryptoQuant

In particular, the Nasdaq has had a more consistent relationship with Bitcoin. Since mid-August 2024, the correlation has remained close to 0.8. 

Bitcoin mirrored the move when the Nasdaq rose sharply through the final quarter 2024. Both assets peaked around the same time. Conversely, BTC also corrected when the Nasdaq corrected. This implied that Bitcoin behaved more like a tech asset in the current market.

Bitcoin Retests $74,800 Support Amid Long-Term Bullish Setup

The current pullback in Bitcoin has tested a significant support level at $74,800. This is the neckline of a long-term inverse head and shoulders (iH&S) pattern. 

Gert van Lagen, a technical analyst, stated that this neckline has been a central part of BTC’s ongoing four-year structure. Bitcoin bounced from this zone recently, and the trend is still intact.

bitcoin price
Source: Gert Van/X

The iH&S pattern started forming in 2021 and has continued through several market phases. It shows four clear bases for the step-by-step development of a parabolic trend. 

Bitcoin recently broke out through the Base 4 region, pulled back, and retested the neckline as support. This structure supported the ongoing bull trend’s momentum. 

It remained intact as long as Bitcoin avoided closing below this critical level on the weekly chart. The parabolic curve and the wave counts indicated the possibility of upward movement if the support is held. 

Measured moves and historical patterns indicated that the projected price path could hit near $300,000. However, the strength of the setup relies on Bitcoin keeping the neckline in the near term.

Equity Market Volatility is Reflected in Short-Term Moves

After a strong run from its 2024 lows, the price of Bitcoin topped nearly $100,000 in early 2025. Since then, it has corrected to just under $80,000. 

This correction coincided with similar declines in the S&P 500 and Nasdaq. This further validated the fact that Bitcoin is acting like a high-risk asset.

For the past 12 months, Bitcoin fell when U.S. stocks fell. When stocks rallied, Bitcoin followed. This relationship demonstrates how macroeconomic conditions like interest rate expectations and investor sentiment drive crypto prices.

Bitcoin price and the S&P 500 index correlation
Bitcoin price and the S&P 500 index correlation | Source: CryptoQuant

BTC is no longer an isolated digital asset but part of a broader market cycle. The charts indicate that it is often during large market moves when Bitcoin and stock indices are highly correlated. 

Bitcoin and both indices almost moved in lockstep from October 2024 to February 2025. The connection between price trends was, in fact, visible, even when the correlation dipped briefly. 

This pattern indicates that Bitcoin will probably continue reacting to changes in the wider financial markets.

Bitcoin Price Outlook Depends on Support and Market Direction

If Bitcoin can hold above the $74,800 level, its next move will depend on it. This zone has been the technical foundation of the current trend. 

If the price is above it, the bullish structure that started in 2022 remains intact. A level failure could lead to a deeper correction or delay further upside moves.

Investors are closely monitoring equity markets and Bitcoin for stabilization cues. Both the S&P 500 and Nasdaq are currently undergoing a correction phase.

Bitcoin’s short-term trajectory remains closely linked to the performance of stock markets. Its strong correlation with indices like the S&P 500 and Nasdaq underscores this connection.

Bitcoin could rebound if stock prices recover. If equities are sold under pressure, Bitcoin could also remain under pressure.

Ripple CTO Drops Cryptic ‘Good News’ Amid Crypto Bloodbath

0

Key Insights:

  • Global financial markets recorded heavy losses this week, including sharp sell-offs across significant cryptocurrencies.
  • Bitcoin, Ethereum, and XRP each suffered significant declines, with total crypto liquidations surpassing $1.4 billion in 24 hours.
  • Ripple CTO David Schwartz posted a cryptic message during the downturn, quickly gaining attention across the crypto community.

Global financial markets suffered significant losses this week, including sharp declines across cryptocurrencies. Total crypto liquidations reached $1.4 billion when Bitcoin, Ethereum, and XRP experienced intense market sell-offs. In the middle of the turmoil, Ripple CTO David Schwartz posted a cryptic message that caught wide attention.

The market-related content was missing from Schwartz’s message, but its release at a strategic time made it popular among investors. When CNBC host Jim Cramer delivered his bleak market prediction to him, Schwartz replied in a way that suggested a market turnaround. 

Schwartz’s comment drew traction because of the ongoing popularity of the “Inverse Cramer” theory among crypto traders. The theory asserts that those movements tend to reverse whenever Cramer makes market predictions. 

The market decline caused investors to interpret Schwartz’s comment as optimistic and ironic. The post did not contain technical analysis but boosted market sentiment during the wild market movement.

Bitcoin Falls Sharply, But Analysts Predict Bottom Formation

The price of Bitcoin decreased by nearly 7% on Monday, spreading anxiety through all cryptocurrency exchange networks. The market decreased in value while the rest of Asia and Western regions experienced selling pressure. Traders responded by searching for potential reversal signals using chart patterns and technical indicators.

Technical expert Michael van de Poppe declared that Bitcoin achieved its minimum point in the recent trading period. Throughout this period of observation, the market showed oversold readouts and followed patterns of previous price levels. Market participants observed that price support levels developed near the $65,000 mark.

Despite the market’s bearish attitude, certain traders initiated new purchasing activities at reduced price points. The currency’s strength in its fundamentals, along with institutional purchasing power, drives this movement. 

Previous historical data indicates that abrupt price drops typically serve as indicators for short-term market rebounds.

Ethereum Suffers Losses Amid Broader Market Pressure

Ethereum followed Bitcoin’s path and dropped over 6% during Monday’s trading session. After the drop, Ethereum entered short-term losses, which carried the price level toward its March support region. The market’s withdrawal of positions caused a decline in Ethereum-linked derivatives trading liquidity.

Ethereum maintained strong foundational performance because the network continued operating reliably. The price drop did not disturb smooth, smart contract usage, and whale accumulation was observed in on-chain data. Ethereum gas fees decreased, indicating less congestion and lower network transactions.

The ongoing work of developers upgrading Ethereum 2.0 proved that investors remained confident about its future value potential. The analysis indicated Ethereum would lead against other alternative coins when macro-level uncertainty vanished. During this period, the prices on different major exchanges displayed substantial variations.

XRP Declines as Ripple CTO Sparks Market Buzz

XRP price fell more than 5%, following the simultaneous decline of the entire cryptocurrency market. Despite the drop, Ripple CTO David Schwartz’s cryptic post sparked widespread discussion online. His supposedly optimistic statement created a brief change in mood, although others took it as sarcastic.

The posted content mentioned financial analyst Jim Cramer’s prediction of a market collapse. Schwartz argued that Cramer’s inaccurate predictions indicated a potential market recovery. The retail trader mentality agreed with these investors, who placed wagers against Cramer when he made his market predictions public.

XRP maintained its price decline, but Ripple operated continuously as the company propelled its international operations forward. XRP continues to grow internationally with global remittance operations even though the United States faces regulatory ambiguities as investors view it as one of the strongest digital assets during price downturns.

Global Tensions Drive Sell-Off Across Markets

Equity markets saw significant market falls because of rising world trade conflicts throughout this period. Economic conflict fears resulted in a more than 10% decline for the Hang Seng Index. The establishment of new tariffs by Beijing against U.S. imports resulted in increased volatility across markets in Asia and America.

The Chinese sovereign wealth fund stepped in to boost local market indices, acknowledging the intense market challenges. Market sentiment stayed pessimistic because of growing international political tensions even after the intervention. The economic consequences of this event spread through three distinct categories: commodities, currencies, and technology stock values.

The simultaneous market downturn among different sectors indicated a close relationship between crypto markets and conventional financial sectors. The market pressure caused risk assets to experience continuous decline as investors chose cash along with stable assets for their holdings. In the past economic cycles, extreme fear between investors tended to signal major turning points.

Ethereum Faces Brutal Breakdown—Peter Schiff Warns Of More Pain

0

Key Insights:

  • Ethereum price continues to decline as bearish momentum strengthens and market sentiment remains largely negative across the crypto space.
  • Economist Peter Schiff warns that Ethereum could fall below $1,000 due to weak fundamentals and poor technical indicators.
  • Schiff compares the current trend to Ethereum’s June 2022 price drop and shows no strong recovery signs.

Ethereum faces worsening market conditions as bear pressure increases while sentiments throughout the crypto sphere remain negative. Market analysts detected escalating sell pressure in the wake of price drops. That’s causing Ethereum to sink under crucial price points. The market’s failure to restore prices has strengthened warnings about additional price decreases.

Economist Peter Schiff made public predictions about additional price declines. He used technical and historical data to justify his views. 

During previous market conditions, Ethereum had demonstrated vulnerability. Schiff made this observation especially relevant to its June 2022 price decline. According to him, Ethereum faces additional depreciation because strong fundamental metrics and network indicators are missing.

As per Peter Schiff, the present performance of ETH indicates worsening conditions compared to Bitcoin, which he supports by referring to unfavorable ETH/BTC value trends. 

Ethereum continues to suffer losses against Bitcoin, which contribute to sustained fearful predictions for its future. According to Schiff, Ethereum provides minimum value when gold standards represent its price.

Peter Schiff Predicts Deeper Ethereum Price Crash

Ethereum experienced critical price drops across the weekend, forcing its value down to $1,400 until a slight price increase stabilized it. According to Schiff, the Ethereum token faces downward potential. It will push ETH price under the $1,000 mark because of consecutive market weakness. 

The altcoin market is facing persistent challenges, and Ethereum feels more downward pressure because of this situation.

The recent market adjustment proves a 20% one-day reduction, which reveals the severity of the current selling activity. According to Schiff, history shows that such price corrections tend to repeat themselves, and he forecasts a future market crash. He confirms that Ethereum holds vulnerable price patterns because no significant support points are nearby.

The distance to resistance points is extensive enough to keep recovery efforts fragile and motionless. The trend for Ethereum markets continues downward, largely undeterred by brief daily rises in value. 

Schiff bases his analysis on a widespread economic weakness that significantly pressures cryptocurrency value assessments.

Ethereum Weakens Against Bitcoin and Gold

Ethereum is worse than Bitcoin in terms of market performance, given that the ETH/BTC pair has been demonstrating continuous downward movement for multiple weeks. According to Schiff, this indicates that investor faith has weakened while money returns to Bitcoin. 

He bases his belief on the current ETH/BTC downtrend to show that Ethereum faces intensified selling pressure compared to other leading digital assets.

Schiff labeled Ethereum charts the worst among all other benchmarks based on the gold-based technical analysis. The ratio strongly rejects expected support levels, backing up future price projection forecasts for continued decline. This indicates that Ethereum has minimal actual value in digital marketplaces.

All price indexes show declining values for Ethereum, which indicates a fundamental technical problem with its underlying system. According to Schiff, the current market trend of Ethereum matches past breakdowns, which led to subsequent price decreases. 

The continuing price weakness between Ethereum and digital and traditional assets could result in significant depreciation for Ethereum.

ETH Struggles Below Key Support Levels

The 24-hour price movement of Ethereum demonstrates its current value of $1,556.3, a 1.45% decline since yesterday. Ethereum tokens rallied to $1,636.7 throughout this period before falling to $1,411.2. Market instability demonstrates bearish dominance because Ethereum cannot maintain its basic short-term price support.

Ethereum has experienced a continuous price decline since March 2025, giving up consecutive important support levels. The asset is currently at levels beneath the major exponential moving averages. That indicates sustained negative market sentiments for the long term. 

Ethereum’s current price position shows deep weakness. That’s because it rests far below all four exponential moving averages, which stay at elevated levels.

Technical indicators validate negative readings because Ethereum is in an oversold region at a Relative Strength Index (RSI) value of 27.40. The average measured by RSI is 37.49, which indicates that brief-term market energy remains inadequate. 

Even though Ethereum remains in an oversold condition, no definitive indications of a market rebound have been established.

ETH/USD 24-hour price chart
ETH/USD 24-hour price chart | Source: TradingView

The MACD indicator indicates that additional price decline risks persist because it shows an expanding difference between its MACD and Signal lines. The MACD line shows -123.9, and the Signal line shows -106.0 to indicate higher bearish divergence patterns. 

Market data, through a histogram, reveals extensive selling pressure at -18.0, thus demonstrating the absence of a bullish trend.

Hong Kong Opens Door To Crypto Staking, But There Is A Catch

0

Key Insights:

  • Hong Kong has started permitting licensed virtual asset trading platforms to offer staking services to clients under strict conditions.
  • The Securities and Futures Commission announced the policy change during the Hong Kong Web3 Festival 2025.
  • The new circular requires platforms to fully control client assets without using third-party custodians.

Hong Kong has taken a definitive step by allowing licensed virtual asset trading platforms to offer staking services to clients. The Securities and Futures Commission (SFC) announced this new permission during the Hong Kong Web3 Festival 2025. This change shows a new strategy to regulate digital assets within Hong Kong.

Return-generating activities related to client assets can now operate because the regulations have changed following an earlier prohibition. The updated policy forms part of Hong Kong’s broader plan to strengthen its virtual asset infrastructure. It also reflects a growing alignment with global standards for digital asset regulation.

Crypto staking services, which operate in Hong Kong, must follow a strict set of new operational, disclosure, and security requirements. A new circular from the SFC established all the obligations platforms must meet. 

Along with increased investor protection, the conditions also implement regulations that boost transparency from cryptocurrency companies operating in the city area.

Hong Kong Sets Strict Rules for Crypto Staking

The staking services of licensed virtual asset trading platforms (VATPs) require clearance from specific deployment requirements. All client assets managed by these trading platforms require complete control or possession by the platform operators. The new guidelines specifically forbid all VATPs from working with external custodians.

hong kong
Source: X

Organizations need to build and sustain powerful internal control systems to prevent operational threats. Stakeholder safety remains protected through adequate measures against hacking attacks, validator inactivity, and software failures that threaten asset safety. Every internal policy must receive regulatory inspection status due to its existence as documented records.

Crypto Staking protocols must provide complete program information to their customers on application websites and platforms. The platform must disclose the costs, restriction periods, unstaking details, and stakeholder security risks to users. Platforms must explain their methods for managing slashing incidents and other hazards of potential loss.

All staking outsource operations from platforms require regular assessment of security measures from external providers. VATPs need ongoing access to inspect the third party’s infrastructure, assess their track record, and manage all risk systems. External arrangements for the platform must meet SFC requirements while following the platform standards.

The SFC demands written authorization from VATPs who wish to provide crypto staking services. Hong Kong’s Commission will assess each platform’s preparedness for the issuance of customized licensing conditions. The firm’s License Agreement will contain these terms, which become legally binding.

Staking Requires Full SFC Pre-approval

The SFC grants special permission for Virtual Asset Funds to participate in staking when they fulfill the established guidelines. Staking activities from authorized virtual asset funds need to be conducted exclusively through licensed VATPs and approved institutional partners. Tight constraints exist to monitor asset holding and operational visibility for such purposes.

Staking-related activities from these funds need SFC approval before starting their operations. The management of crypto staking limit requirements effectively protects against possible liquidity risks to which these funds are exposed. The SFC performs proposal assessments, which include an evaluation of fund structure and operational capacity assessment.

The chosen staking activities should match the fund’s investment plans and risk management parameters. All information about staking activities, together with projected returns, must be present in official fund disclosures. Funds’ reporting duties include showing metrics related to performance and explaining losses from penalties applied to validators and network failures.

Approved funds should preserve complete documentation about their staking activities. It must show funds’ validator selection methods, performance reviews, and risk management plans. Updates regarding the staking activities need to be sent immediately to the SFC and other relevant stakeholders.

The regulatory guidelines avoid dangerous asset exposure yet actively support innovations within the virtual asset industry. This standard guarantees the protection of investor interests when operating in varied market settings. Crypto staking activities require participation from well-governed, qualified funds since governance is an eligibility requirement.